Table of Contents
Collecting, collating, filtering, and analyzing stock market data to create a better investing and trading portfolio is not only difficult, but it can be a very daunting and cumbersome task. Even if you get to that part, what are the chances that you can actually make informed decisions? Risk management is one of the most important factors while investing and trading in the stock market and we believe that if you have an authoritative source of data where you can do proper research and analysis on your own, you are in for a sweet ride to financial stability!
Introducing StockEdge’s own star boy called Edge Reports. So what did we do here? The objective was to really collate data on the following subjects and present them to our fellow traders and investors so that they can become independent research analysts:
- Comprehensive research on case studies of companies.
- Conference call analysis of the company’s current finances and future growth projection.
- Infographic presentation of 5 trending stocks/mutual funds.
- Financial highlights, Issue details, and Company overview of IPOs.
- Recent stocks to watch for entry, exit, and risk analysis.
Consistent research and analysis is up to you but our goal is to give you the edge (we try to live by our brand name) in developing your portfolio. So if you are serious about making money, let us dive deep into the edge reports features and how you can use our stock market research and analysis tool to decipher the matrix!
Using Edge Reports in StockEdge App:
Now let us explore how we can utilize this Edge Report to select winning stocks for trading:
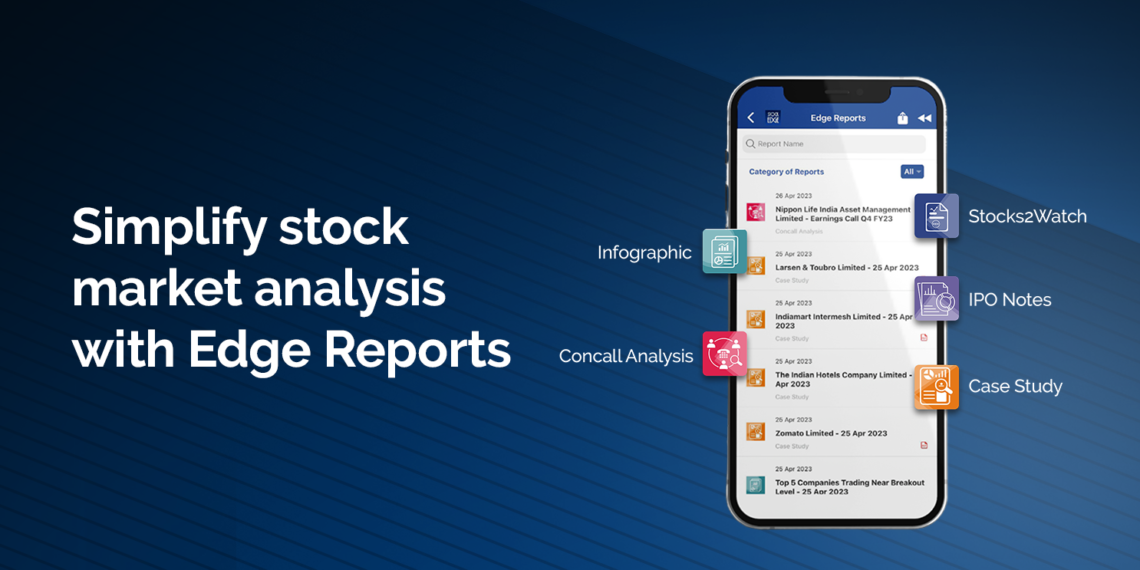
In StockEdge, there are five types of Edge Reports at your disposal for you to examine and conduct your own research:
Let us discuss in detail the types of Edge Reports:-
Case Study
The Case Study is a research document that instructs users to utilize fundamental data to analyze a stock from StockEdge. The user can ascertain a stock’s various fundamental data points and how to employ them from StockEdge.
The most pivotal part of the Case Study is the View Report tab, which leads the user to the case study and related links for the stock, sector, and industry. These links enable users to augment their analysis to more precision and refinement. This segment also includes segment-wise sales volume about the company and its sector.
The user can also observe a spider graph of the six qualities of a stock and an edge meter score, which encapsulates the stock’s performance. This section considers six parameters Growth, Profitability, Efficiency, Solvency, Valuation, and Quality of the stock.
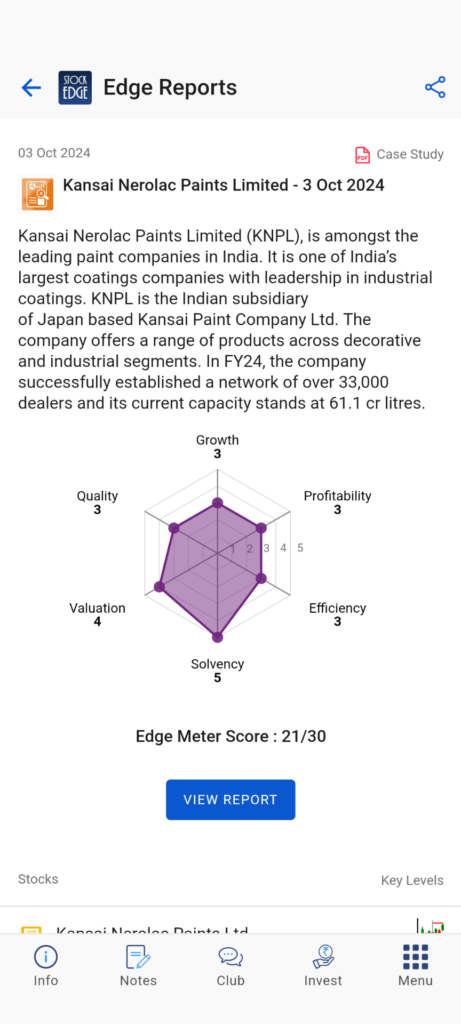
Growth
We observe the growth metrics of the stock, which include sales, EBITDA, and PAT growth. These metrics provide the growth chances of the company from the previous data. These give us the Growth edge meter score.
Profitability
We observe the profitability metrics of the stock, which include the EBITDA margin, ROCE, ROE, and PAT margin. These metrics provide the profitability chances of the company from the previous data; these parameters give us the Profitability edge meter score.
Efficiency
We observe the Efficiency metric, which is determined by vital indicators such as the cash flow of the company, the working capital, free cash flow, and the asset turnover ratio.
These indicators provide insights into the company’s operational efficiency and effectiveness, which are significant parameters for the efficiency edge meter score.
Solvency
We observe the Solvency of the stock, which is determined by evaluating critical metrics such as debt to equity and interest coverage ratio. These indicators show the company’s ability to meet its current obligations and pay its interest expenses.
The current ratio is vital to the Solvency quality, which measures the company’s liquidity. By scrutinizing the Solvency quality of the stock and considering metrics, we can gain a deeper understanding of the company’s financial position. These give us the Solvency quality of the stock and its edge meter score.
Valuation
We observe the stock’s valuation, which encompasses critical valuation metrics like the Price-to-Earnings (PE) ratio and the dividend yield. These key indicators provide insight into the amount investors are willing to pay for the company’s earnings and dividends, thereby determining the stock’s attractiveness level.
It also mentions the stock’s crucial support and resistance levels, which are fundamental to its potential price movements. These elements ultimately determine the Valuation quality of the stock and its edge meter score, which is an essential measure of its potential value.
Quality
We observe the Quality of the stock, which considers the future outlook of the company, its competitive landscape, its sector potential, and shareholding pattern. These factors reflect the qualitative aspects of the company’s business model, strategy, market position, growth prospects, and ownership structure. These give us the Quality edge score of the stock.
All these edge meter scores are summed, and we get the final result for the stock’s edge meter score. This score summarizes the overall performance of the stock based on its six qualities.
Concall Analysis
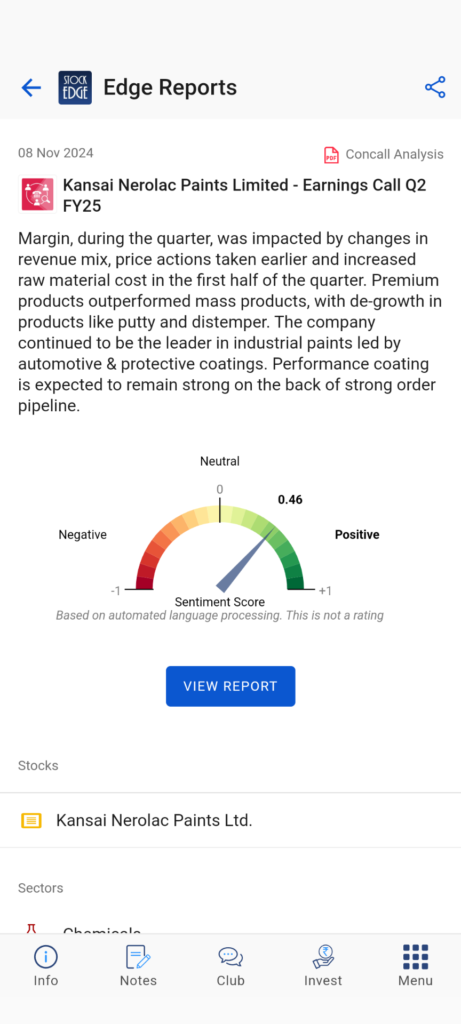
A Concall Analysis is an informative summary of a company’s conference call event. In this event, the company management discloses the financial performance and other business operational details to the investors and analysts. The Concall Analysis aims to assist investors in staying updated on the latest operations in the company and the industry and to provide them with an outlook for future activities and plans.
The analysis also comprises a Sentiment Score that varies from -1(negative) to +1(positive) depending on the aspects discussed in the report. The report will save investors time by not going through the concall reports. This segment also contains the Future Outlook of the company, future deals, financial highlights, and many more. The Sentiment Score offers a cursory impression of the stock’s current and future growth prospects based on the tone and content of the conference call.
The user can access the Concall Analysis for any stock by clicking on the View Report tab on the website. The user can also find links to the stock and its sector and industry for further analysis and comparison.
For Example, In the ConCall of IndusInd Bank Limited – Earnings Call Q4 FY23 we provide-
- Financial Highlights -This section will present a table format featuring all the crucial banking ratios, including the CASA Ratio, GNPA, NNPA, CRAR, C/I ratio, and others. It will also display the net profit and net interest income on a year-over-year (YoY) basis, along with the percentage change YoY.
- Loans and Deposits-This section will inform investors about the bank’s loan growth in various segments, such as microfinance, non-corporate books, corporate segments, and more. It will also provide information on the deposits received by the bank from multiple sources, including CASA, retail, and affluent deposits.
- Asset Quality and Capital Adequacy-This section will inform investors about the bank’s overall asset quality ratio, including GNPA and NNPA, as well as slippages in NPA, upgrades, recoveries during the quarter, and other updates that will be easy to understand.
- Other Business Updates-This section will inform investors about the liquidity coverage ratio, disbursement growth in each segment, information about the savings deposits base, and other related updates.
- Future Outlook-This section will inform investors about the future goals of the company’s top management, providing guidance for metrics such as ROA, loan growth, retail deposit base, and more.
Edge Reports is one of the paid tools offered by the StockEdge app. Check out StockEdge’s premium plans to get the most out of it. Check out StockEdge Offers to find the best deals to subscribe.
Infographic
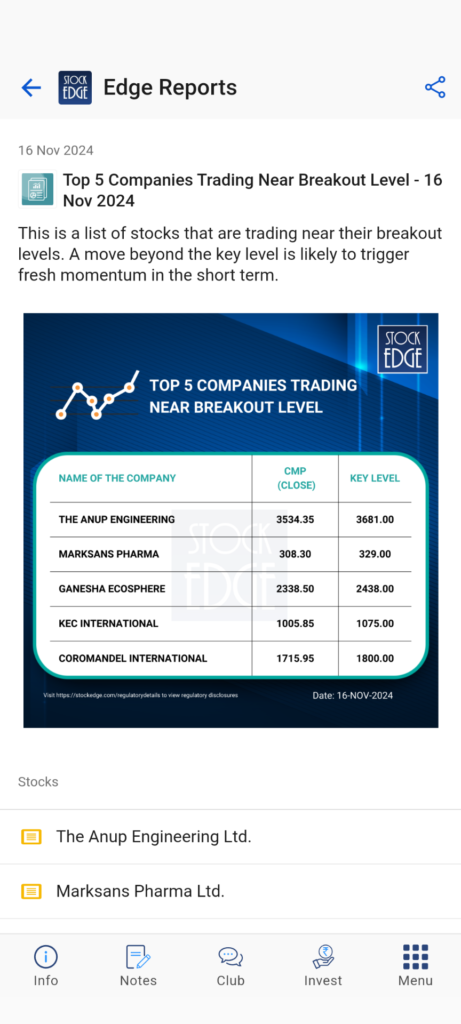
Infographics will provide visual depictions of data and information based on various types of analysis, such as fundamental and technical analysis. The information assists users in analyzing the stocks and the market, not as a recommendation to buy or sell.
The Investor can click on the Image to see an enlarged view of the Infographics that display different aspects of the stocks, such as trading near breakout level, high EBITDA margin, high net interest income margin quarterly, and many more.
These are usually those stocks that are near their breakout level. The user can also find links to all the stocks listed in the Infographics for further analysis and comparison. The links will direct the user to the detailed and advanced level of study for each stock.
IPO Notes
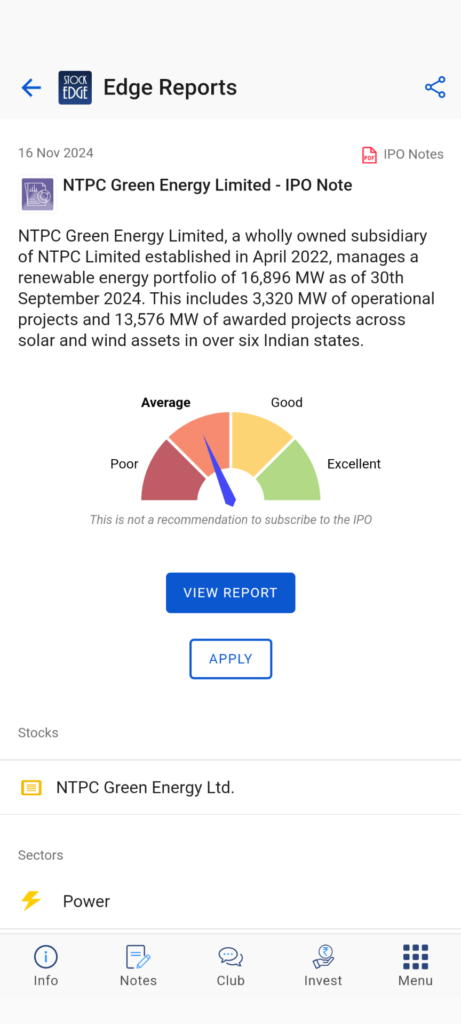
IPO notes are comprehensive edge reports that furnish in-depth information about a company floating its shares to the public for the first time. They encompass various facets of the company, such as its overview, background, products, market prospects, rivals, hazards, and promoter shareholding. The financial statement is taken from the Draft Red Herring Prospectus (DRHP), including information on profit and loss, a notice of assets and liabilities, a statement of cash flow, and key metrics of the last three years.
They also comprise a SWOT analysis that delineates the company’s strengths, weaknesses, opportunities, and threats. The Strength informs about the MOAT of the company if any, and options the company can have in the future; threats will talk about its competitors, and weakness will have information about the company’s problems.
It also gives the essential timelines the investor needs to know from the issuing date to the IPO listing date. IPO notes assist investors in appraising the company and its IPO proposition. This segment also has a metric that grades the company on a scale of poor, average, good, and excellent based on the above criteria.
For Example, In the upcoming IPO of Mankind Pharma Limited, we provide-
- This section will inform investors about all the essential details of the IPO, including the issue date, price band, bid lot, issue size, number of shares, post-issue implied market cap, and P/E ratio for the financial year.
- About The Company section will inform investors about the company’s business in the domestic market and domestic sales in a simple pie chart. This segment will also provide information about the company’s brand and share percentage of domestic sales.
- Sector Outlook-This section will inform investors about the Indian pharmaceutical market and its year-on-year growth with graphical data.
- Competitive Landscape-This section will inform investors about the top players in the industry and their market capitalization, revenue, earnings per share(EPS), profit after tax margin(PAT), return on net worth(RoNW), and price-to-earnings ratio( P/E).
- Risk Factors-This section will inform investors about the company or the industry’s risk factors.
- Financial Statements section will inform investors about the profit and loss statement, asset and liability statement, cash flow statement, and key metrics of the company for the last three years.
Stocks2Watch
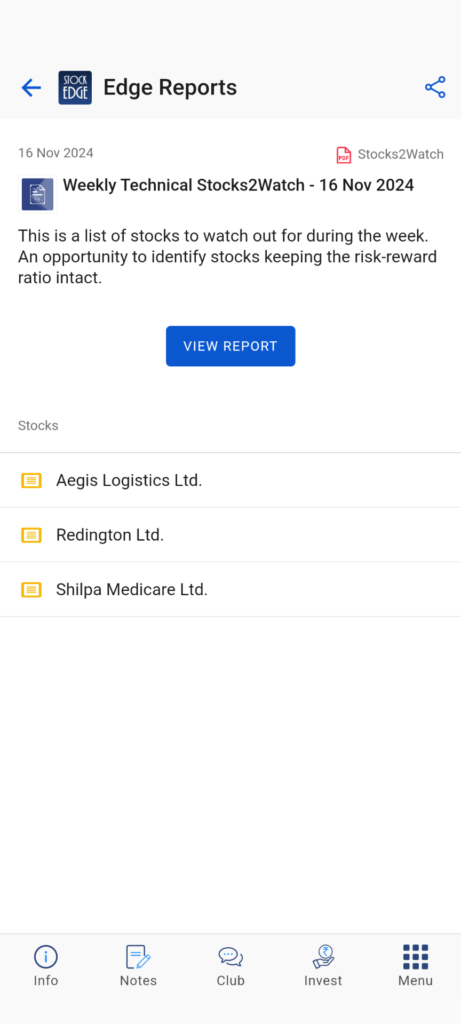
Stock2watch is a popular segment of Edge reports, that furnishes investors with a list of stocks with potential for the week. This segment aims to assist investors in finding stocks with a favorable risk-reward ratio and answer queries such as when to enter and exit, how much to risk, and why to buy. This segment helps investors to manage their risk and maximize their potential profits.
This is accomplished by employing price action trading, Fibonacci retracement strategies, RSI, and others to analyze the stocks. Using these strategies, Stock2watch provides investors with a list of stocks that are likely to make a move in the future. The segment endows investors with the tools to make informed investment decisions.
Bottomline
The above are examples of Edge Reports, which provide fundamental data points about stocks and keep investors updated with the latest activities.
Studying these Edge Reports on the Stockedge App lets you pick winning stocks and trade accordingly.







Very nice report with detailed discussion and showing in-depth features of stock edge .