Table of Contents
The first quarter of FY 2024-2025 is over, and companies are about to publish their quarterly results (Q1 FY25). The quarterly results season is very crucial for the Indian stock market as the performance of listed entities will decide the fate of the market in due time. Moreover, the season of quarterly results give rise to several opportunities in the market for both traders and investors.
Traders focus on capturing short price action movements based on the result outcome, whereas investors use this as an opportunity to make fresh entry into strong performing stocks and churn their portfolio stocks.
In this blog, let’s learn a unique techno funda strategy using quarterly results.
Quarterly Results: A Brief Introduction
The financial performance announced by a company every quarter is known as the quarterly results. It generally gives an understanding of the company’s performance and financial position to the shareholders of the company. Quarterly results are an important source of information for investors to make informed decisions in the stock market.
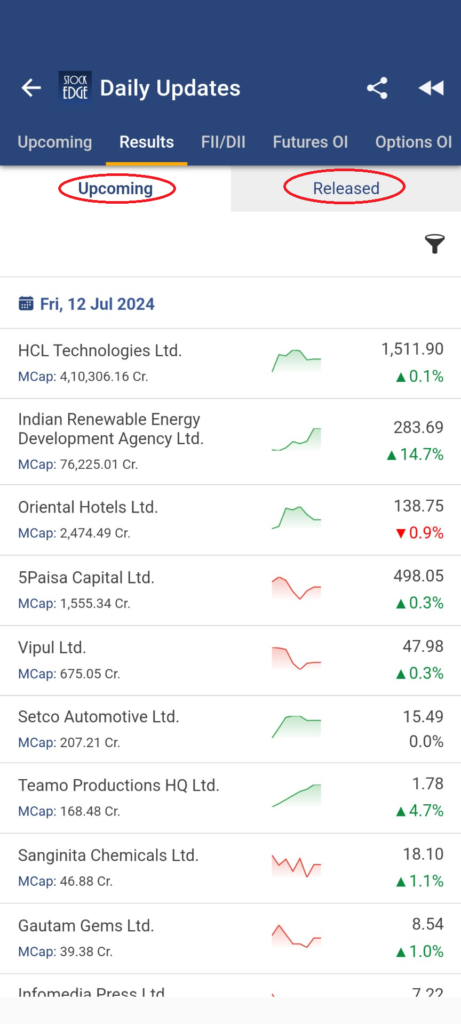
As the result season is starting, you can check the quarterly results for today or the upcoming quarter results in the stock market from the StockEdge app as you see from the screenshot below:
Major Elements of Quarterly Results
The quarterly results provide you with an update about both the top-line and bottom-line figures of a company. There are three major elements that you must analyze in the quarterly results. They are as follows:
- Sales/Revenue
A company’s top line growth can be easily analyzed by tracking the overall increase in revenue or sales of the company. A growing company will have an increase in sales on a QoQ and YoY basis or both. A company’s sales signifies the demand for its products or services in the market and therefore indicates future prospects of the company. Hence, increasing the sales or revenue of a company is a crucial factor for its future growth.
- EBITDA
EBITDA is basically the company’s earnings before interest, taxes, depreciation and amortization. An Increase in EBITDA indicates earnings from its core business operations has improved. Depreciation or amortization is a non-cash expense for the company, And If you deduct depreciation and amortization as expenses, you get the operating profit (EBIT) of a company.
- Net Profit/PAT
A company’s bottom line growth is analyzed by monitoring its net profit, which is commonly known as PAT (Profit After Tax). The profitability of a business depends highly on its increase or decrease in sales/revenue, and how efficiently it manages its business can be derived from the company’s EBITDA. Lastly, the net profit of the business signifies its sustainability in the long run. As the company continues to increase its profitability over time, it suggests that the company may continue to grow, which will boost confidence among its shareholders.
However, tracking the financial performance of the company from the quarterly report published can be tedious and time consuming as there are more than 6000 listed entities in the stock market. That’s where StockEdge can guide you.
Using the result section of StockEdge, you can monitor the quarterly performance of the companies at a simple glance. In fact, you can even filter stocks based on your requirements.
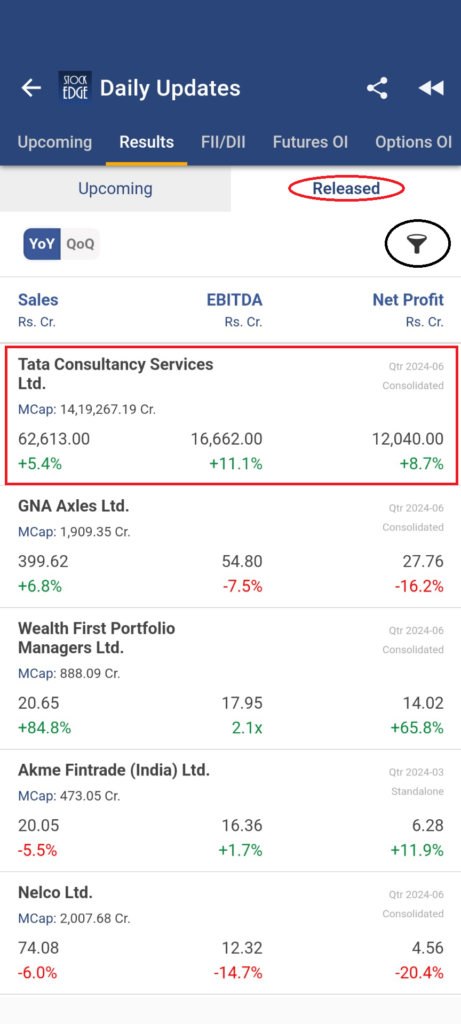
For instance, here is an example of TCS that recently published its quarterly results for Q1 FY25. You can simply analyze the quarterly performance of the company at a glance as it shows the performance of sales, EBITDA and net profit at once.
Building Techno Funda Strategy
A techno funda strategy involves both fundamental and technical parameters to scan stocks in order to make trading or investing decisions in the market. There is a never-ending list of fundamental and technical parameters that traders or investors use to find strong stocks in the market. Moreover, during the quarterly results, there is an increase in volatility in the market, especially in stocks that have announced their quarterly earnings.
A positive or a negative outcome of the quarterly results has direct implications on the stock price of that company. Therefore, traders should be extra cautious while trading during the quarterly results, as there is a high-risk, high-reward scenario. In contrast, the investors can either take a fresh position or shuffle the existing portfolio of stocks based on the quarterly result.
However, for those who are into momentum investing- a techno funda approach seems more sensible. To learn more about momentum investing, you can read one of our previous articles – Unveiling the Battle Between Value Investing and Momentum Investing.
The stepping stone for creating a techno funds strategy is to decide on the list of parameters, both fundamental and technical. Then, you need to filter out the stocks to analyze their price chart to decide on entry and exit on the stock.
Fundamental Framework
The framework is based on the quarterly result update published by the company, and it involves the fundamental criteria for selecting a list of stocks. They are as follows:
- High Increase in Quarterly Sales (YoY)– As mentioned earlier, a company’s sales or revenue is an integral element that drives the company’s core business, creates brand value for its products or services and builds a large customer base. An increase in sales of a company helps to build all of these. Higher the sales better the potential for growth of the company in future.
A YoY increase in quarterly sales means that the company has delivered more sales compared to the previous year in the same period or quarter. For instance, the sale of Zomato Ltd. has increased by 73% in Q4 FY24 compared to Q4 FY23. - Increasing Quarterly Sales– It means that every quarter the company’s sales is increasing consistently which indicates robust sales turnover by the company. To identify companies that are delivering consistent increases in quarterly sales, you can use our StockEdge scan: Increasing Quarterly Sales (Results). It gives you the list of stocks where net sales for past fiver quarters is increasing compared to its respective previous quarter.
- Quarterly Net Profit Growth (YoY)– A company’s growing net sales is a signal of strong business efficiency. It means the company is able to generate higher net profit in the recent quarter compared to its previous year’s corresponding quarter. The YoY increase in net profit signifies that the company has generated higher net profit in the current quarter as compared to the same period last year.
Similarly, using StockEdge scan for Quarterly Net Profit Growth YoY you can identify such strong stocks in the market. - Quarterly EBITDA Growth (YoY) – The growth in earnings before interest, taxes, depreciation and amortization indicates an increase in profitability from its core business. This quarterly growth in EBITDA not only means that the company has earned EBITDA positive in the latest quarter but also increased it year over year (YoY). Check out StockEdge Fundamental Scan for Quarterly EBITDA Growth YoY to identify strong, growing companies.
- Consistently increasing Quarterly EPS – Earnings Per Share, commonly known as EPS, is a metric used to find out how much profit each outstanding share of common stock has earned. It is calculated by dividing the net earnings available to the shareholders by the average number of outstanding shares. However, there is no magic number to define a good EPS across companies. However, an increase in quarterly EPS is generally considered a positive indicator for the company’s shareholders. Find stocks that have consistently increased their quarterly sales from the StockEdge scan: Consistently Increasing Quarterly EPS
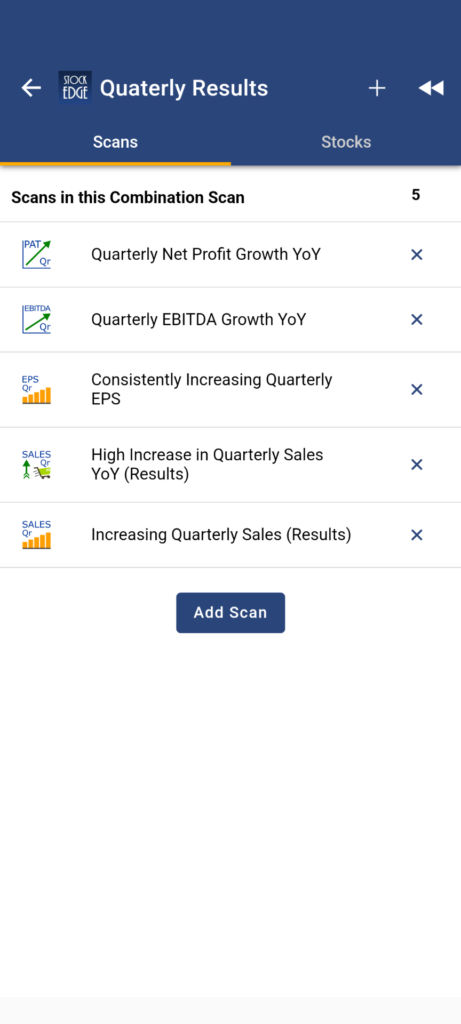
Now, the fundamental framework is well established, and you can even find stocks that fulfill the parameters using StockEdge scans. However, filtering out stocks with each scan could cause a problem if a stock fulfills one criterion that may not fulfill any other criterion from the fundamental framework. Therefore, to avoid such confusion, you can create a combination scan in StockEdge, which will provide you with a list of stocks that have fulfilled all the fundamental parameters.
Simply go to My StockEdge and create your own combo scan, as shown in the image below:
Technical Framework
The technical parameters are based upon the idea of momentum investing. The basic concept is that stocks that have performed well in the past will continue to perform well in the near future, and vice versa for poorly performing stocks. There are two major technical parameters based on momentum concept that can be added to the techno funda strategy which are as follows:
- Relative Strength (RS): The RS (Relative Strength) measures the price performance of a stock relative to another stock, index, or benchmark. However, for the techno funda strategy a comparison of price performance of a stock compared to its performance of the Indian benchmark index Nifty 50 can indicate the outperform performance of the stock suggesting strong momentum.
- Relative Strength Index(RSI): RSI Indicator is one the most useful technical indicators to identify momentum of a stock. Usually when RSI crosses 50, stock starts to show bullish momentum. That’s when the RSI indicator is trending up.
Now, both the fundamental and technical parameters are well defined. It is time to implement the techno funda strategy in action. You can watch the following YT video for a detailed step-by-step guide on how you can identify stocks based on the above techno funda parameters discussed.
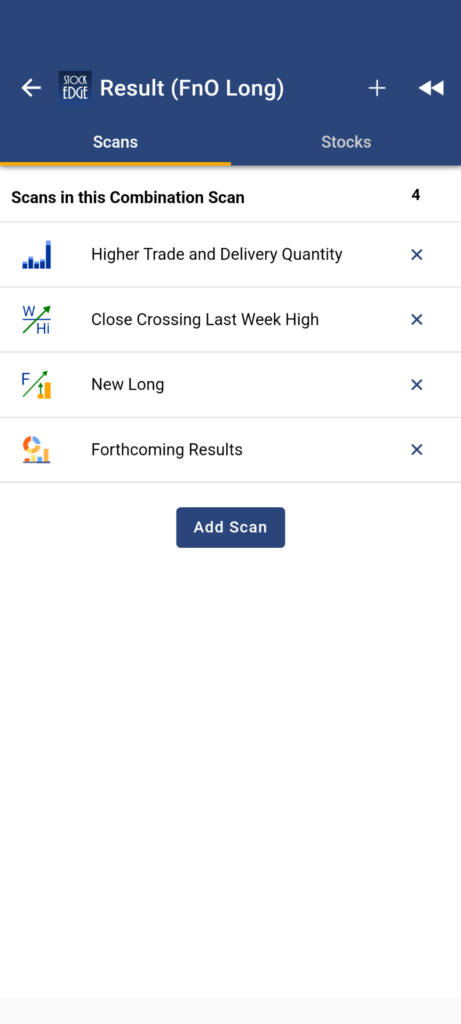
Apart from the above mentioned techno funda strategy which is essentially part of momentum investing, there is another strategy for all the futures & options traders out there who wish to capture the short term price action move during the quarterly results.
The strategy involves higher delivery volume, new long in futures contracts along with price action movements in those stocks which are about to announce their quarterly results soon. All these parameters can be clubbed into a combination scan in StockEdge.
The Bottom Line
The quarterly results announcements by companies are important to track if you are an investor or trader. This gives you valuable insights about the company’s business and can help you make informed decisions in stock investing or even trading. A techno funda strategy is a unique way to implement quarterly results into ongoing price action movements in stock, which can guide you in identifying strong stocks with good financial performance every quarter.


