Key Takeaways
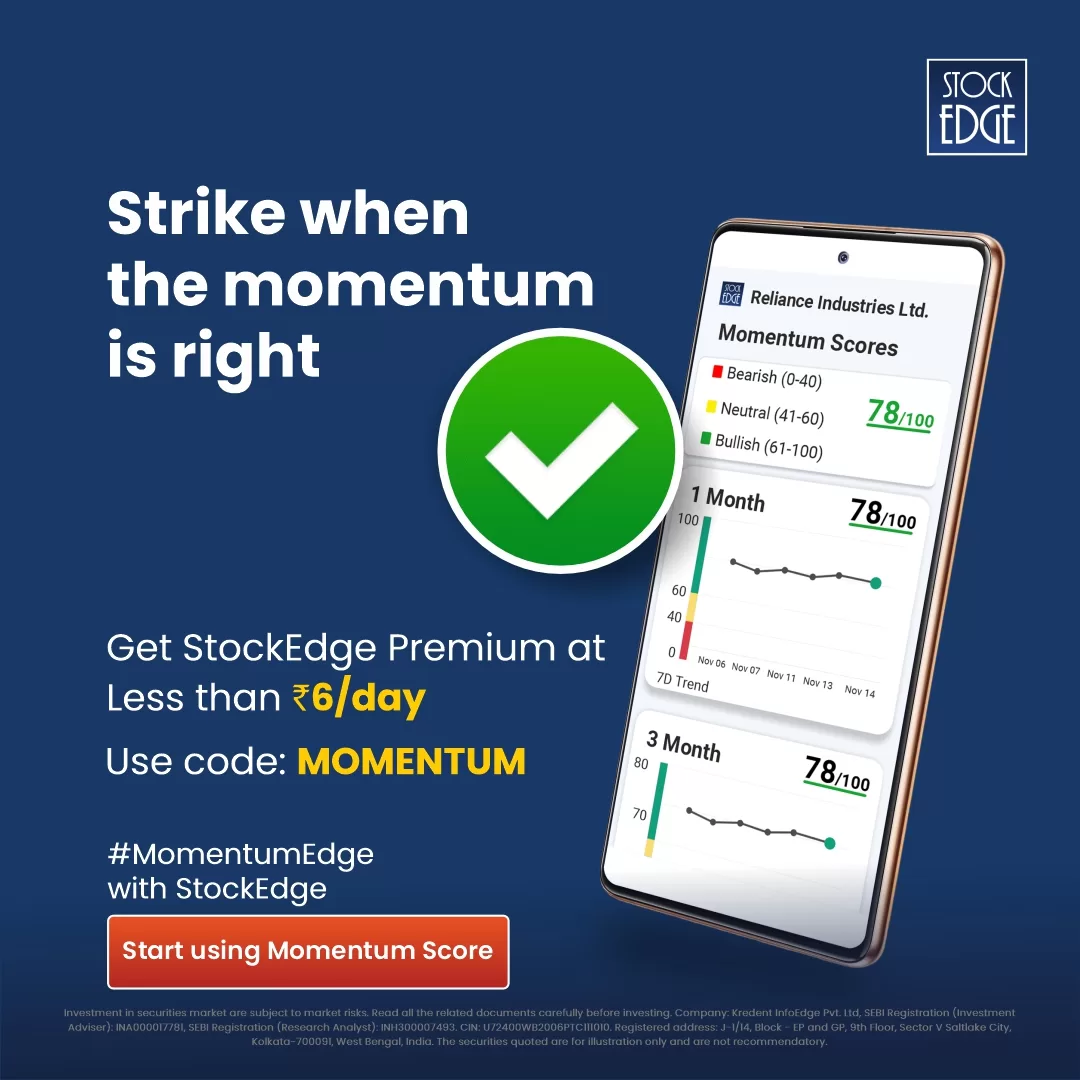
- Momentum Score: It’s a single number between 0 to 100 that shows the strength of a stock’s price movement based on 1, 3, and 6-month trends.
- Easy to Use: You can track momentum scores for stocks directly in your watchlist or portfolio on the StockEdge app to spot strong or weak performers.
- Timeframe Based: Short-term traders can focus on 1 or 3-month scores, while long-term investors should look at 6-month momentum for better confirmation.
- Smart Scans: The app has built-in scans to help you filter high or low momentum stocks quickly, saving you time and effort in research.
- Simple Yet Powerful: The feature brings complex technical analysis to everyone in a clean, easy-to-understand format perfect for both new and experienced traders.
Ever wondered how some stocks keep rising while others struggle? That’s where momentum scores come in! They help investors spot stocks that are gaining strength and could continue their upward trend.
Think of it like a speeding train. It helps you spot stocks that are already moving fast and might keep going.
The New Age of StockEdge version 13 has released its latest update, with new features such as Stock’s Momentum Score, Momentum Score Scans in Technical Scans Group, Momentum Score in Portfolio & Watchlists and Momentum Score in Sectors & Industries.
In this blog, we’ll break down momentum scores in an easy-to-understand way and show you how they work and how you can use them to make smarter investment choices.
Momentum Scores
Momentum scores help traders gauge the strength and direction of a stock’s price movement over different time frames – one month, three months, and six months, depending on your trading style.
A higher score (61-100) indicates strong bullish momentum, while a lower score (0-40) signals bearish momentum. Neutral scores (41-60) suggest a consolidation phase.
Traders and investors can effectively use the Momentum Score feature to refine their strategies:
- Short-term traders and swing traders should focus on 1M and 3M scores to identify high-momentum stocks for quick gains, ideally looking for those with scores above 70 in the short term.
- Medium- and long-term investors can rely on the 6M score to confirm sustained strength, with stocks scoring 75-80 or higher signalling strong trends.
Additionally, momentum-based stock screening helps traders identify stocks entering a strong uptrend while avoiding those that are losing momentum, ensuring they align with prevailing market trends.
Let us take the example of InterGlobe Aviation Ltd. (IndiGo) as of April 1, 2025.
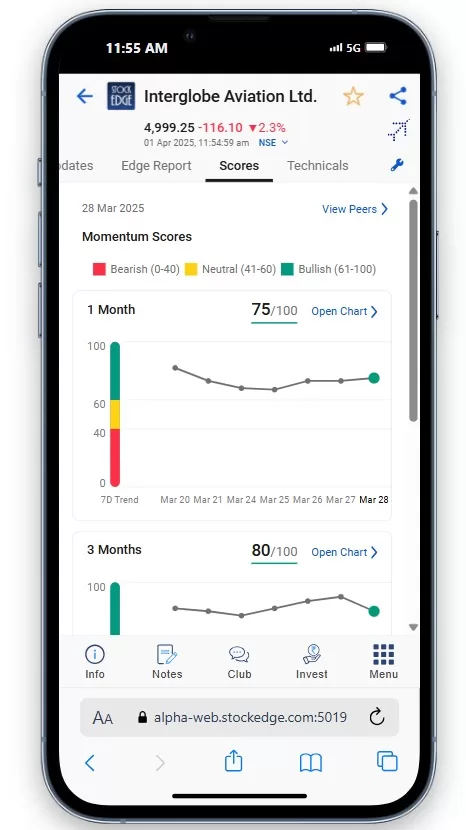
Momentum Scores:
- 1-Month Score: 75/100 (Bullish)
- 3-Month Score: 80/100 (Bullish)
The 7-day trend for both 1-month and 3-month scores appears stable, with a slight upward move on March 28.
This suggests strong momentum in the stock over the short and medium term. If you’re considering a trade, it might be worth checking volume trends, relative strength, and technical confirmations before making a decision.
Also, you can plot the Momentum Scores by clicking on the StockEdge Indicators on the Edge Chart to confirm it with price and other indicators as shown below:
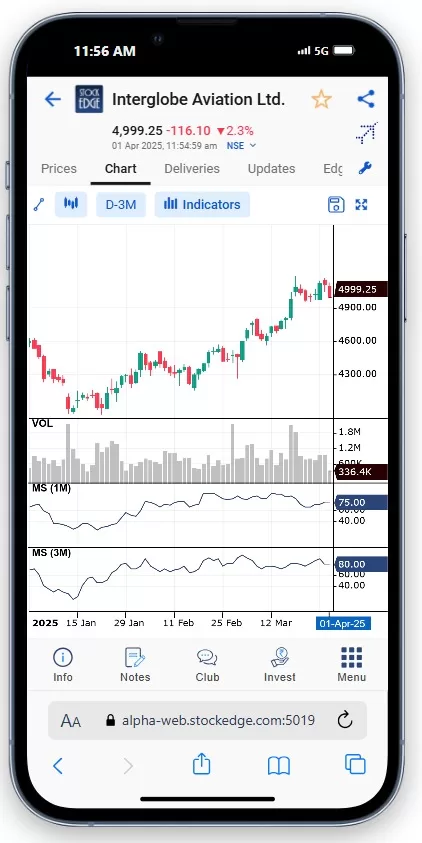
By tracking momentum scores, traders can identify potential breakouts, reversals, or trends, making them a valuable tool for momentum-based trading strategies.
Momentum Score Scans
Momentum Score Scans analyze the price strength of stocks over various time frames like 1 month, 3 months, and 6 months.
By assessing whether a stock is bullish, neutral, or bearish, these scans help traders and investors spot opportunities for entry, exit, or holding positions.
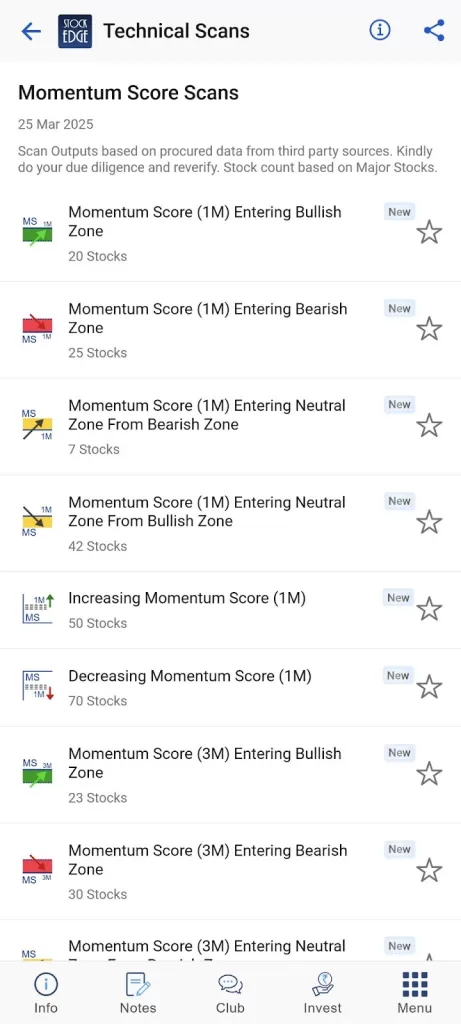
They provide actionable insights for momentum-based trading strategies, making it easier to capitalise on strong price trends and avoid weak-performing stocks.
Momentum Score in Portfolio & Watchlists
You can also compare the momentum score of different stocks that you have added to the SE Watchlist and Portfolio.
This will help you identify stocks that are gaining or losing momentum in your portfolio.
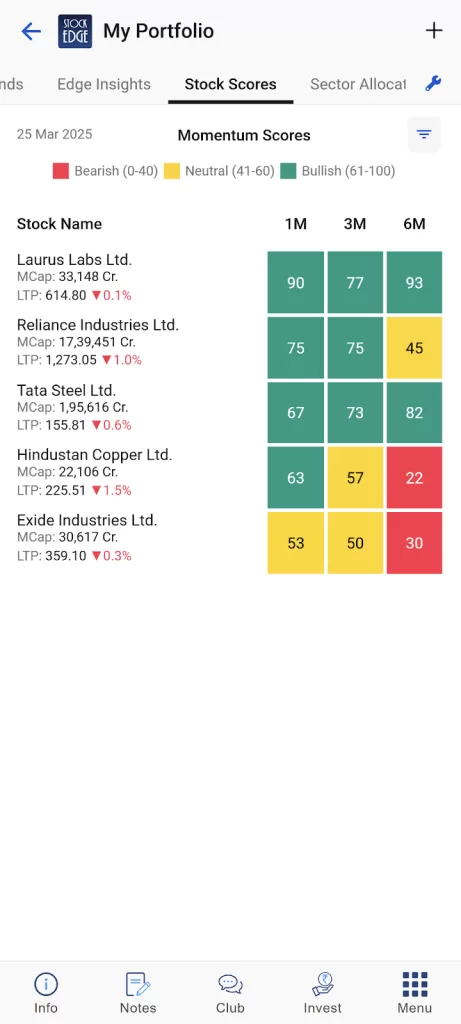
For example, in the above image, we can see that Laurus Labs Ltd. is the most bullish stock and has been gaining momentum over the past 6 months.
Momentum Score in Sectors & Industries
You can also compare the momentum scores of the companies in the same sector. Let us compare the Momentum Scores of companies under the Banking Sector:
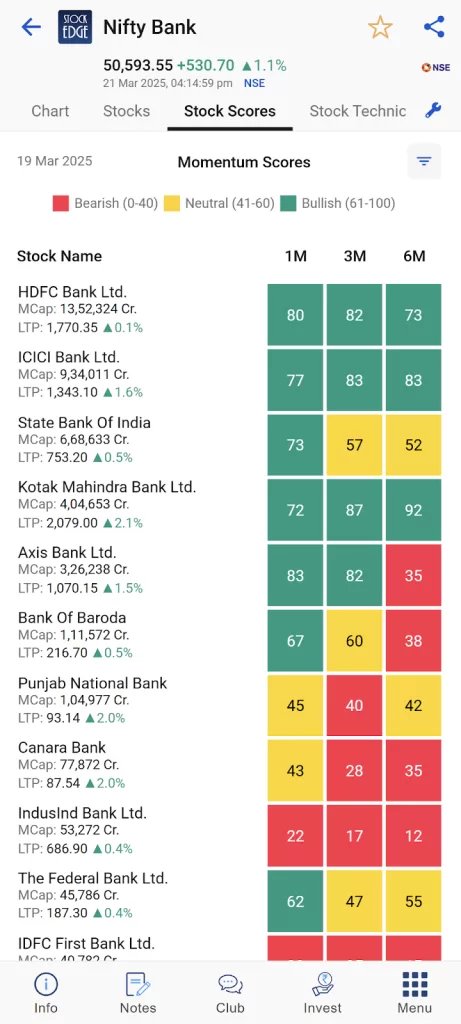
From the above image, we can see that:
- HDFC Bank & ICICI Bank: These two major private sector banks show consistently bullish momentum across all three time frames. This suggests strong and sustained upward price trends.
- Kotak Mahindra Bank: Also shows strong bullish momentum, particularly over the 3-month and 6-month periods.
- Axis Bank: Has bullish momentum in the 1-month and 3-month time frames, but the 6-month momentum is bearish. This indicates a potential shift in the stock’s trend.
- State Bank of India (SBI): This shows a significant decline in momentum over time. It was bullish in the 1-month time frame but has turned bearish in the 6-month time frame.
- Other Banks: The remaining banks (Bank of Baroda, Punjab National Bank, Canara Bank, IndusInd Bank, Federal Bank, and IDFC First Bank) generally show weak or bearish momentum across all time frames.
Conclusion
Momentum scores simplify the process of identifying strong stocks by highlighting those with sustained price movements. By using this strategy, you can focus on stocks that have the potential to keep climbing rather than chasing random market moves.
Whether you’re a beginner or an experienced investor, momentum can be a valuable tool in your decision-making. So, the next time you’re analyzing stocks, keep an eye on their momentum. It might just help you ride the trend to better returns!
Download our StockEdge App now!
And if you haven’t already, do check out our latest StockEdge Version 13.3 to explore what’s new in the app.


