Table of Contents
Technical indicators are essential tools for stock traders to use while making well-informed decisions. However, there are a plethora of technical indicators available at your fingertips. The most common yet powerful technical indicators are the Relative Strength (RS) and RSI Indicator. Yes, both sound so similar, yet they serve different purposes. This blog aims to clarify the differences between RS and the RSI indicator and how you can effectively utilize both of them for trading the stock market.
What is the RS?
The RS (Relative Strength) measures the price performance of a stock relative to another stock, index, or benchmark. It helps traders and investors understand how well a particular stock is performing compared to the overall market or its peers. However, in general, relative strength is useful for measuring the strength of a stock compared to the benchmark index, which is Nifty 50 for our Indian stock market.
Calculating the RS Indicator
The calculation for the RS is straightforward:
Relative Strength of a stock = Stock Price / Benchmark
This ratio chart is plotted in the chart to provide a comparative measure, making it easier to identify the outperformance or underperformance of a stock.
Using StockEdge charts, you can easily identify a stock’s relative strength. This is how?
- Go to the StockEdge app or web.stockedge.com
- Open up a price chart of a stock.
- Add indicators from 📶 sign and select RS (MKT), which is basically a ratio chart of your given stock divided by Nifty 50 for a period of 55 days.
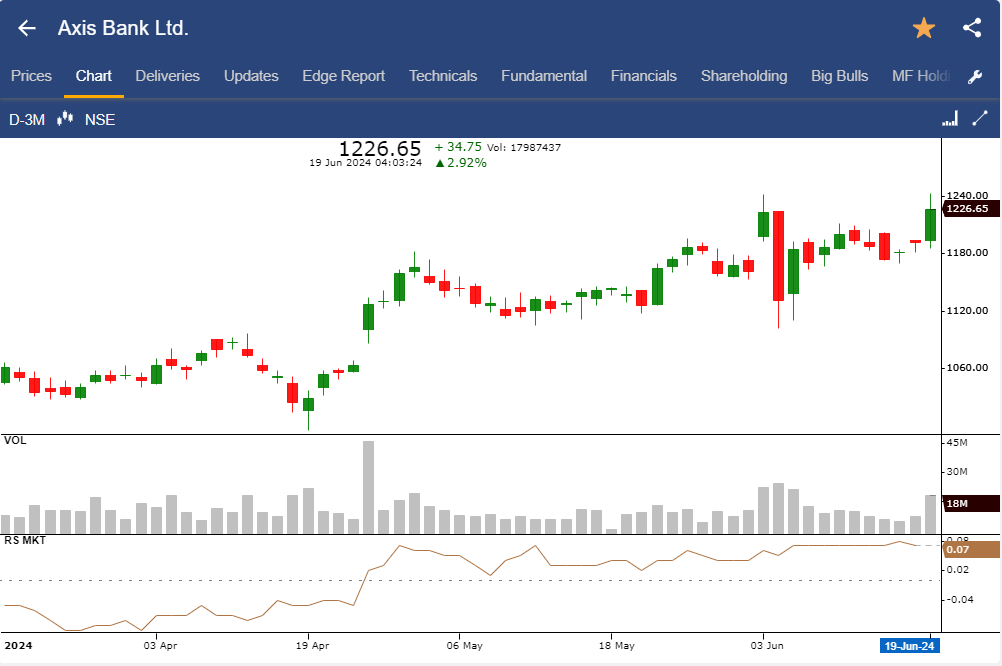
As you can see from the chart of Axis Bank Ltd., the RS (MKT) is plotted below the price chart and there is a dotted line throughout the chart which represents positive and negative areas. When RS is above the dotted line or above 0 is considered as RS positive which means the stock is outperforming the benchmark index in Nifty 50 in the past 55 days. In contrast, when RS (MKT) is below the 0 line, it represents that the stock is underperforming the benchmark index, Nifty 50.
Applications of the RS Indicator
The RS Indicator is primarily used for:
- Comparative Analysis: Traders use it to compare the strength of one stock against another or against an index.
- Trend Identification: It helps in identifying which stocks are gaining momentum compared to the market.
- Portfolio Management: Investors can use RS to shift their portfolios towards stronger-performing assets.
How to identify Strong Stocks?
StockEdge is the perfect analytical tool that can help you identify stocks that are outperforming or underperforming the benchmark index or sectoral index. Moreover, you can also filter stocks that have just turned RS positive, which can help you identify the start of the momentum of a stock. Using our Relative strength price scans, you can filter stocks based on your preference. Here is a complete list of relative strength scans available at your fingertips through the StockEdge app.
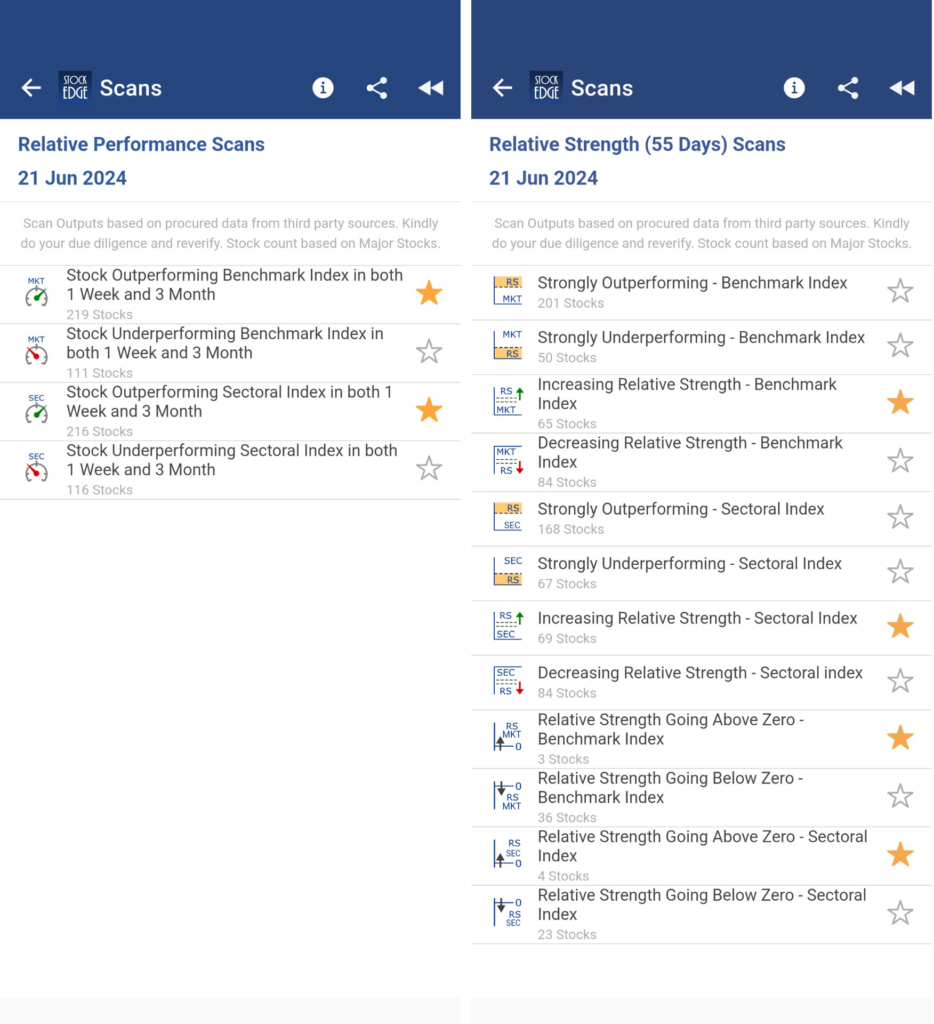
As you can see, the list of scans based on relative strength is enormous. There are relative strength performance scans and RS (55) scans (which are more useful for identifying stocks with increasing or decreasing momentum).
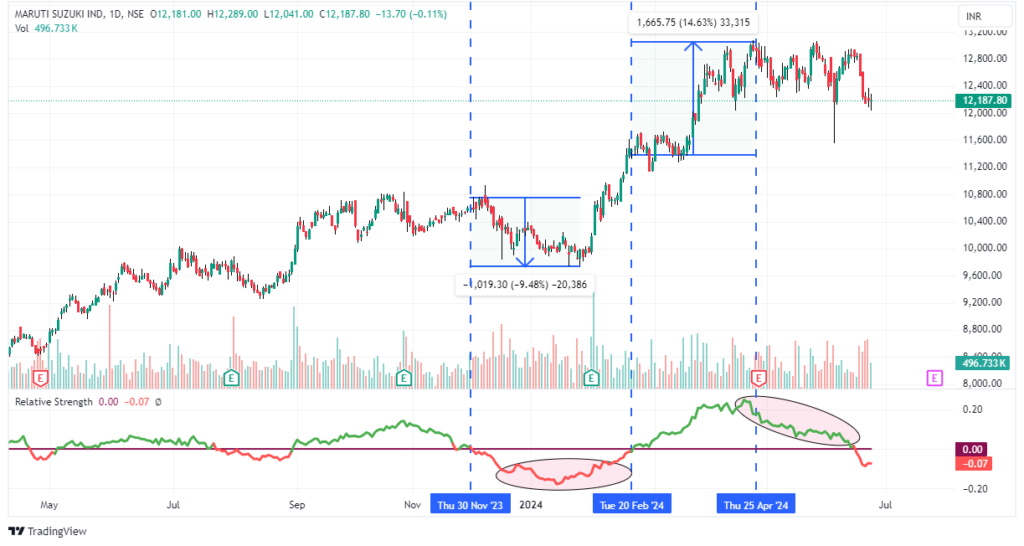
For instance, here is an example on the daily chart of Maruti Suzuki Ltd. The RS 55 indicator is plotted below the price chart, and when it turns positive, it is signified with a green line and a red line when RS turns negative.
So, in recent times when the stock RS turned negative, the stock declined nearly 10%, whereas when the stock RS turned positive, it sharply increased by 14% but as the RS indicator started to decline but was still positive, the stock lacked momentum and therefore it started to trade range bound.
Hence, an increasing or decreasing phase of RS also indicates the current momentum of the stock.
What is the RSI Indicator?
The Relative Strength Index or commonly known as the RSI Indicator is a momentum oscillator that measures the speed and change of price movements. It was developed by J. Welles Wilder who was an American mechanical engineer. However, he is best known for his work in technical analysis as he has developed several other technical indicators that are now considered to be the core tenets of technical analysis.
Calculating the RSI Indicator
The RSI is calculated using the following formula: RSI=100−100/1+RS
where: RS=Average Gain/Average Loss
The standard number of periods used to calculate the RSI value is 14.
The RSI oscillates from 0 to 100 range which helps to identify overbought or oversold levels in a stock. In general, when the RSI of a stock oscillates to 30 it indicates the stock is oversold and indicates a possible bullish reversal. In contrast, when the RSI indicator of stock oscillates to 70 it indicates the stock is overbought and a possible bearish reversal may occur.
However, there are certain scenarios where the stock’s RSI reaches 70, but there was no reversal, and vice versa, in case the RSI reached 30. Therefore, reversal based on overbought or oversold may differ, so it is important to follow price action moves in a stock and then analyze RSI indicator or added conviction on your trades.
Applications of the RSI Indicator
The RSI Indicator is used for:
- Identifying Overbought/Oversold Levels: RSI values above 70 indicate overbought conditions, while values below 30 indicate oversold conditions.
- Divergence Analysis: There are divergences between RSI and price that can signal potential reversals. To learn more about divergences, you may read this blog: The Ultimate Guide to Trading Divergences.
- Trend Strength Measurement: The RSI can also help to determine the strength of a trend. For instance, when the RSI crosses 50, it indicates that the stock is gaining strength and possibly triggers a bullish momentum in the stock.
How to identify momentum stocks?
RSI Indicator is one the most useful technical indicators to identify momentum of a stock. Usually when RSI crosses 50, stock starts to show bullish momentum. That’s when the RSI indicator is trending up. But there are more than 6000 listed stocks in the market. How to filter stocks whose RSI is crossing 50 or showing an overbought or oversold zone? StockEdge scans are a perfect tool to filter out momentum stocks using the RSI indicator scans.
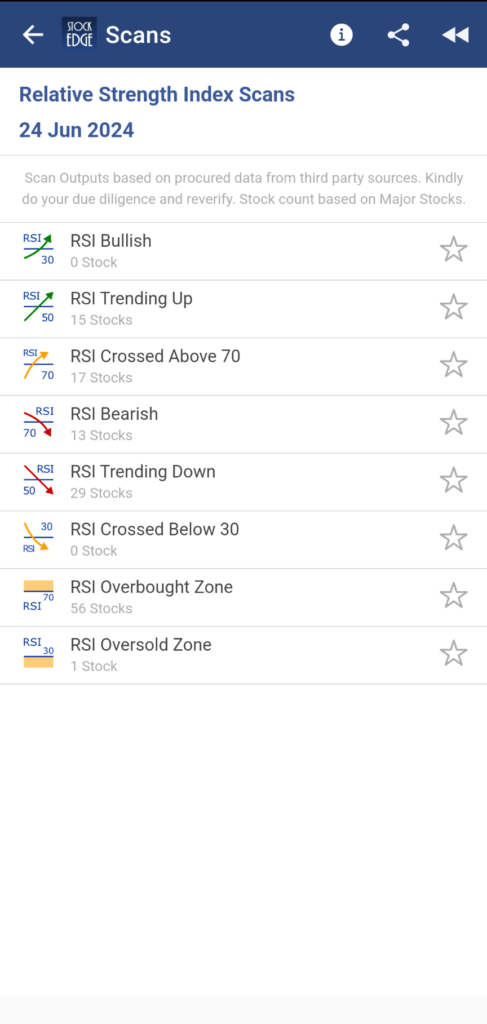
As you can see, there are an enormous number of scans available based on RSI indicators. Not only can you filter out overbought and oversold stocks, but you can also scan stocks where RSI > 50, which is a sign of increased bullish momentum.
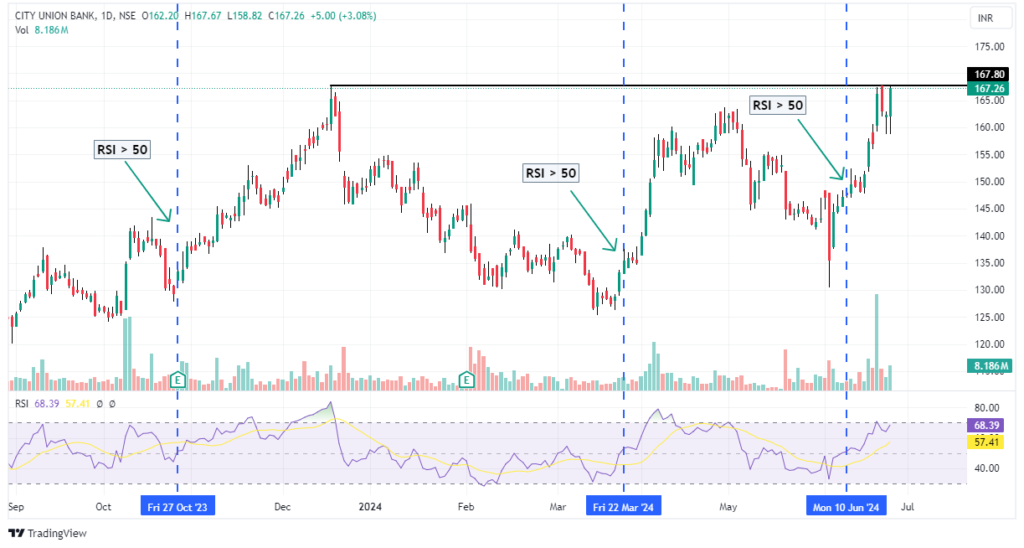
For instance, here is a daily price chart of City Union Bank Ltd., as and when RSI crossed 50, a strong bullish momentum has been witnessed each time. Therefore for swing trades, RSI trending up can be a good trading opportunity.
Difference Between RS & RSI Indicator
The RS and the RS Indicator both sound so familiar and now that you know the details of each technical indicator, there is a clear distinction between them. Let’s explore the differences:
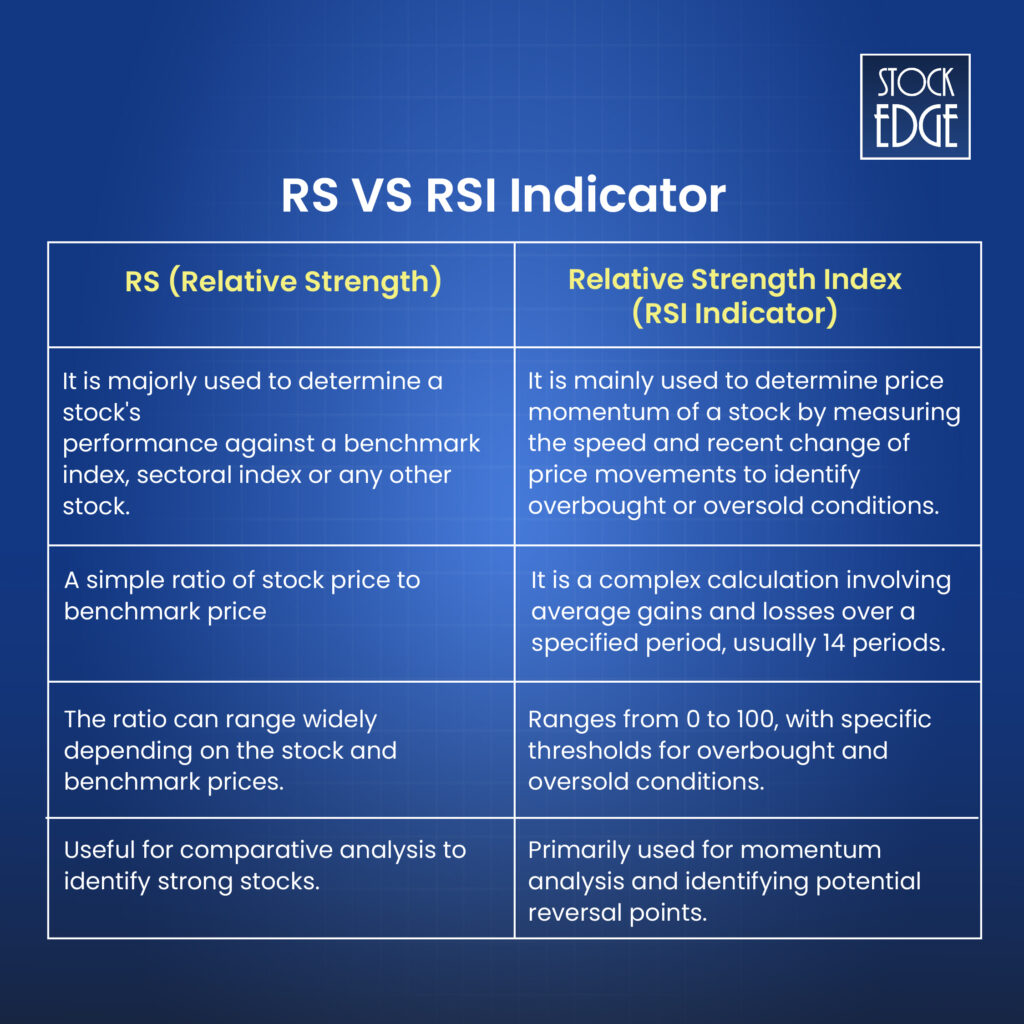
When to Use RS vs. RSI Indicators?
Are you still struggling to choose between the RS and RSI indicators for your trading strategy? Both have their own uniqueness. The objective of using RS is to identify strong stocks which is determined by comparing a stock’s performance against its benchmark index, whereas the aim of RSI indicator is to determine overbought or oversold level of a stock and its price momentum.
Therefore, while you are analyzing your portfolio of stocks, using RS it is easy to determine the strong stocks and segregate the weak stocks out of your portfolio. In contrast, RSI indicators can be used for making entry and exit in a stock. The RSI indicator helps to identify potential reversal as it indicates overbought and oversold levels of stock.
Combined Power of RS and RSI Indicator
In technical analysis, combining two or more technical indicators can add more conviction in your trading. Moreover, a trading strategy consists of major price action moves along with a set of technical indicators which derives entry and exit in a stock. The Relative Strength (RS) and RSI Indicator are powerful technical indicators and combining both of them can create a trading strategy.
Trading Strategy with RS & RSI Indicator
- Identify Strong Stocks: Use the RS indicator to find stocks that outperform the benchmark index, which is Nifty 50.
- Analyze Momentum: Apply the RSI indicator to these stocks to determine their momentum and look for overbought or oversold conditions.
- Entry-Exit Decisions: Based on the RSI indicator, decide whether to enter, hold, or exit a position.
For instance, check out the recent price action move by HDFC Bank Ltd.
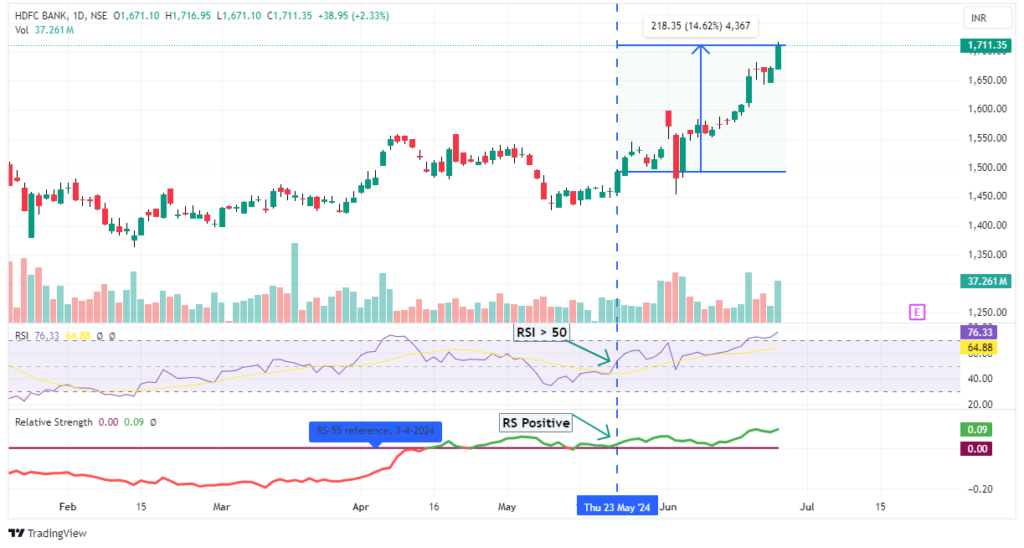
On 22nd May, RSI(14) crossed 50, which is a sign of bullish momentum, along with the daily RS(55) is also positive, which shows greater conviction that it is a strong stock as it is outperforming the benchmark index Nifty 50. Since then, the stock has surged nearly 14%. Now that the RSI indicator is approaching levels of 70 indicates stock is overbought and profit booking can be done at current levels or one can trail its stop loss.
Now that you have an understanding of how you can frame your own trading strategy using RS and RSI indicators. The question is how to scan stocks like HDFC Bank Ltd, and others where you have defined your criteria which will filter out stocks for you.
As mentioned earlier, you can scan individual stocks based on RS or the RSI indicator. Can you really combine both the scans? No worries. You can easily create your own trading strategy using StockEdge’s ‘My Combo Scan‘ feature. Simply add the list of scans based on your trading strategy to filter out stocks for trading.
To know more how to create your own combination scan in StockEdge, read Optimize Your Stock Selection: Leverage StockEdge Scans
Conclusion
At last, the confusion between similar-sounding technical indicators, RS & RSI Indicator, came to an end. It is important that you use both indicators in conjunction, which will enhance your trading skills. Using the right set of technical indicators at the right time can really improve your skill-set as a trader. Therefore, use them vigorously to find your unique trading strategy.
Happy trading!


