Table of Contents
Introducing StockEdge version 12.1: The new age of StockEdge has come up with its latest update, which enhances functionality, bringing new and powerful features to analyze the stock market. We at StockEdge have always focused on offering one of the best analytics tools for our users, and we are committed to it. From our last update of version 12.0, we have received multiple feedback from our users that have encouraged us to release the next updated version of 12.1.
We believe in ‘Self is Smart’, and the StockEdge app offers the best way to analyze the stock market by yourself. Whether you are an investor or trader, StockEddge is a great analytical tool that can help you analyze the stock market.
What’s New?
In today’s blog, let’s discover the latest updates of the app. The latest version brings useful tools for traders as well as investors. Update to the latest version or download today!
Let’s explore the updates which are included in StockEdge Version 12.1:
1. Relative Strength Scans (21 days & 21 Weeks)
StockEdge Scans are the most powerful analytics tool that can filter out stocks based on your criteria. There are more than 6000+ stocks in the Indian stock market, and finding which one to buy/sell or invest in is a big challenge, especially for the retail market participants. Currently, we have almost 300+ scans in the StockEdge app, and we are on a mission to add more that can be useful to both traders and investors in the stock market.
Relative Strength, commonly known as RS, is one such indicator that helps to spot the market leaders. It identifies stocks having strong bullish momentum that are outperforming the benchmark index, i.e., Nifty 50.
We already had RS(55) scans. It identifies stocks that are currently outperforming or underperforming the benchmark index in the last 55 days. But now, in the latest version, 12.1, we are adding RS(21) scans for both daily and weekly. This means that you can now identify stocks that are outperforming or underperforming the benchmark index in the last 21 days as well as 21 weeks.
Here is a glimpse of RS (21 days & 21 Weeks) you get in the latest StockEdge version 12.1:
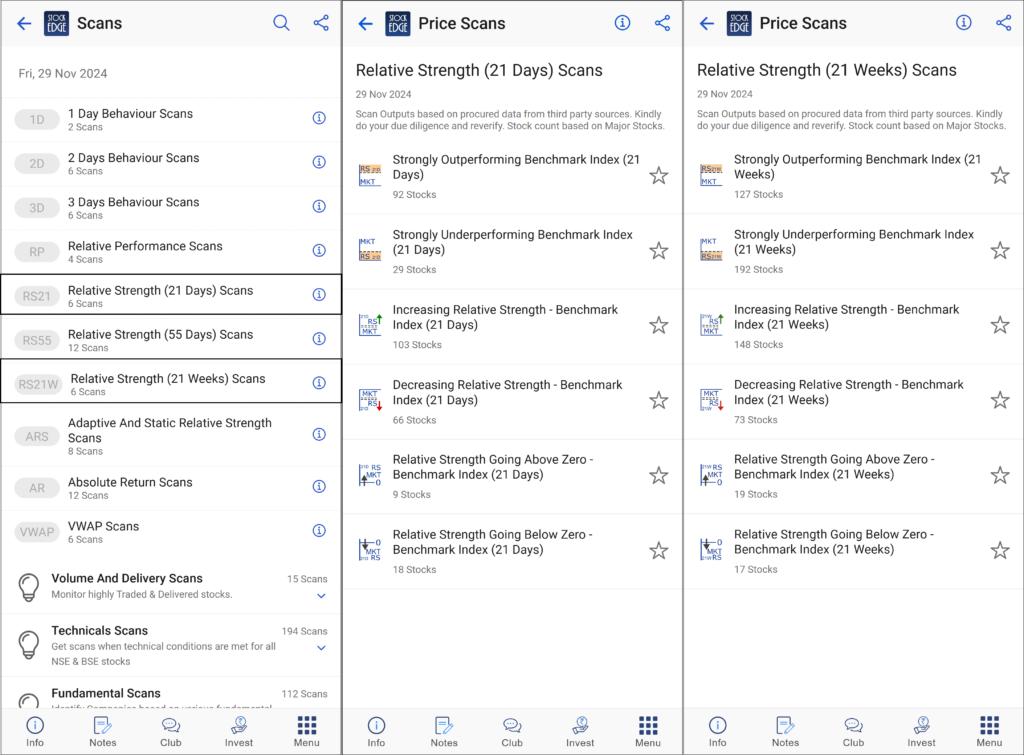
But where do you find Relative Strength Scans (21 days & 21 Weeks)?
- Go to the StockEdge app or visit web.stockedge.com
- Click on the Analytics tab to find Scans
- Click on Price Scans to find RS 21 days and 21 weeks
2. Weekly Technical Scans (SMA & EMA)
Simple moving averages and exponential moving averages are very powerful technical indicators for traders to identify the overall trend of a stock.
A simple moving average (SMA) is a technical analysis tool that smooths out price data helping traders to identify the trend of a stock. It calculates the average price over a specified period.The most common time periods are 5, 10, 20, 50, 100 and 200. SMA assigns equal weight to each price point.
An exponential moving average (EMA) is another technical analysis tool that also smooths out price data, but it gives more weight to recent data points, making it more responsive to price changes.
Both SMAs and EMAs are used to identify trends and potential reversals in the market.
In the StockEdge app, we already provide scans based on SMA and EMA, which provide bullish and bearish signals that are helpful in making short-term trading decisions. However, with the latest version, update 12.1, the SMA and EMA scans are available on a weekly time frame, which gives traders more flexibility in identifying the trend of the stock both in the short and long term.
A weekly scan of SMA and EMA can be very helpful, especially for positional traders. Here is a glimpse of Weekly Technical Scans (SMA & EMA):
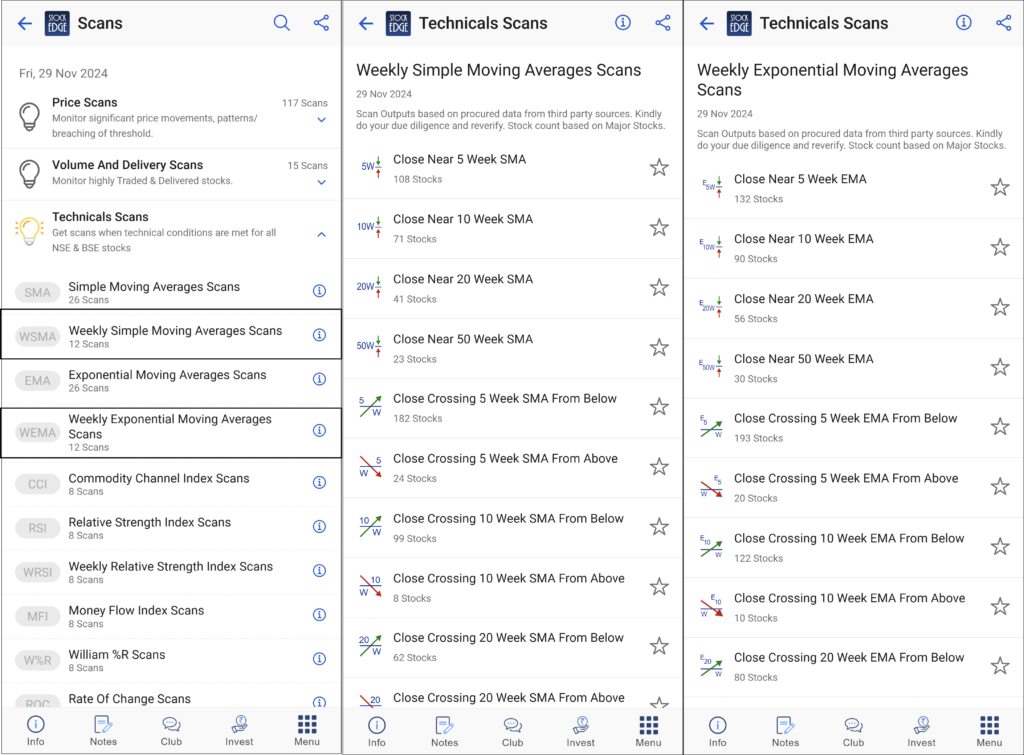
But where do you find Weekly Technical Scans (SMA & EMA)?
- Go to the StockEdge app or visit web.stockedge.com
- Click on the Analytics tab to find Scans.
- Click on Technical Scans and, you can see Weekly Simple moving average scans and Weekly Exponential moving average scans
3. Common Stocks under Investor Portfolio
Curious to know which stocks have caught the eye of India’s top investors? The investor portfolio section of the StockEdge app showcases insights on the portfolio of several big bulls of the Indian stock market like Ramesh Damani, Rakesh Jhunjhunwala, Ashish Kacholia, Vijay Kediaa and more! It shares the list of stocks held by both individual investors and institutional investors. Not just that, you can even view the key changes in their portfolio. So, what’s new in StockEdge version 12.1?
In the latest version, you can identify the stocks that dominate the portfolios of major institutional investors and prominent market bulls. These stocks are commonly held by various market stalwarts and institutional investors. We have introduced a new tab in the investor portfolio section that highlights stocks with the highest concentration of major market bulls.
Here is a glimpse of the Investor Portfolio section showing the most commonly invested stocks across top investors.
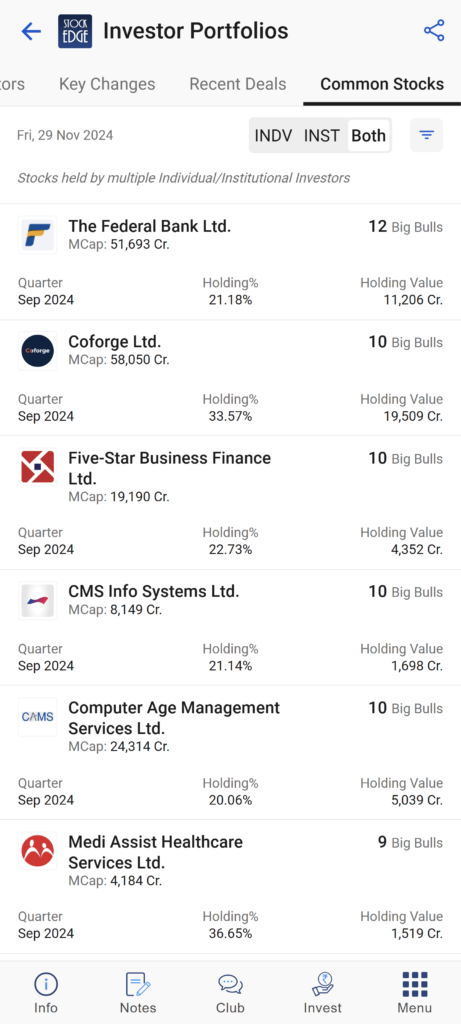
As shown in the screenshot above, The Federal Bank leads the chart, emerging as the most commonly held stock among 12 big bulls and other institutional investors as per the last quarter. You can also view the total holding value and holding percentage. By default, it shows common stocks held by both individual investors and institutional investors. However, you always have the option to choose for yourself if you wish to view the list of common stocks held by only individual investors or institutional investors.
So, for an investor, this feature is a gold mine. In general, retail investors bang upon big market stalwarts regarding which stocks they are investing in. The investor portfolio can now show you the most common stocks where the big individual and institutional investors are investing, which can give you a sense of confidence to invest your money in those stocks.
The Bottom Line
At StockEdge, consistency has always been our cornerstone, driving us to enhance features and empower retail market participants. Staying true to our mission of helping users become self-reliant in stock market analysis, we proudly embrace our motto: Self is Smart. The latest StockEdge 12.1 update offers simple yet powerful tools to elevate your stock analysis experience.
We highly value your feedback and invite you to share your thoughts with us at [email protected] or in the comments below. Your input helps us continue refining and introducing impactful features to StockEdge!


