Key Takeaways
- Mutual Fund Section Overview: A single place to track and manage all your mutual fund investments with clear insights and a user-friendly dashboard.
- Portfolio Tracking & Summary: View returns, allocation, and performance of all your portfolios across equity, debt, and hybrid funds at one glance.
- Sector & Market-Cap Allocation: Check your fund exposure by sector and market cap, including the hidden allocation within mutual fund schemes.
- Consolidated Holding View: See your direct stock and mutual fund holdings in one combined list to understand overlaps and concentration better.
- Notes & Watchlists: Add personal notes and create watchlists to track and compare mutual fund schemes over time.
StockEdge provides real-time data of Mutual Funds showcasing industry trends, AMC trends, category-wise , and scheme-wise trends, providing a holistic view of the increasing assets of the Indian stock market.
1. My SE
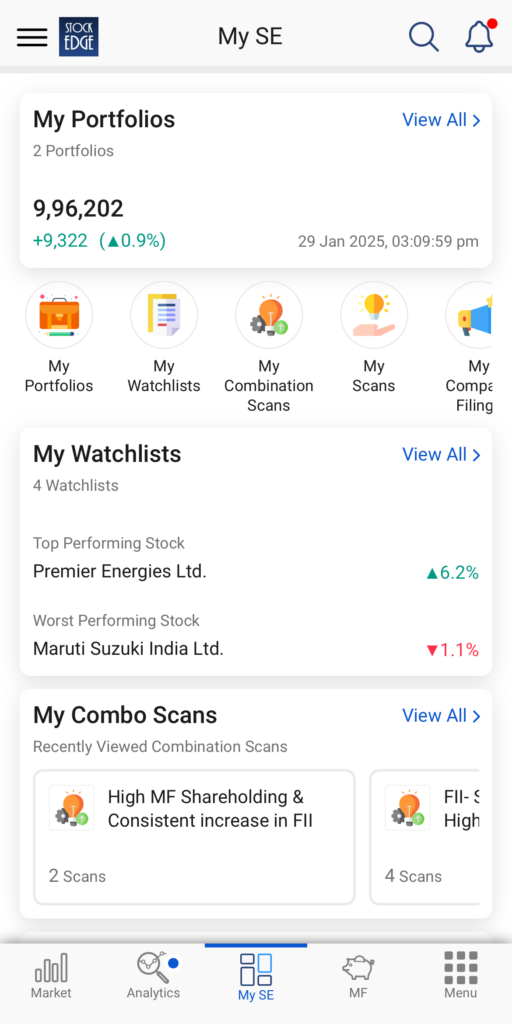
One powerful feature in analyzing mutual funds is the My SE section in StockEdge WebApp. You can analyze all your mutual fund schemes in one place and make an informed decision about your asset allocation percentage, sector exposure, investment value, etc.
2. My Portfolio
Summary
My Portfolios within My SE empower you to do so. Not only can investors add multiple portfolios from different stock-broking apps, but you can also add portfolios of family members.
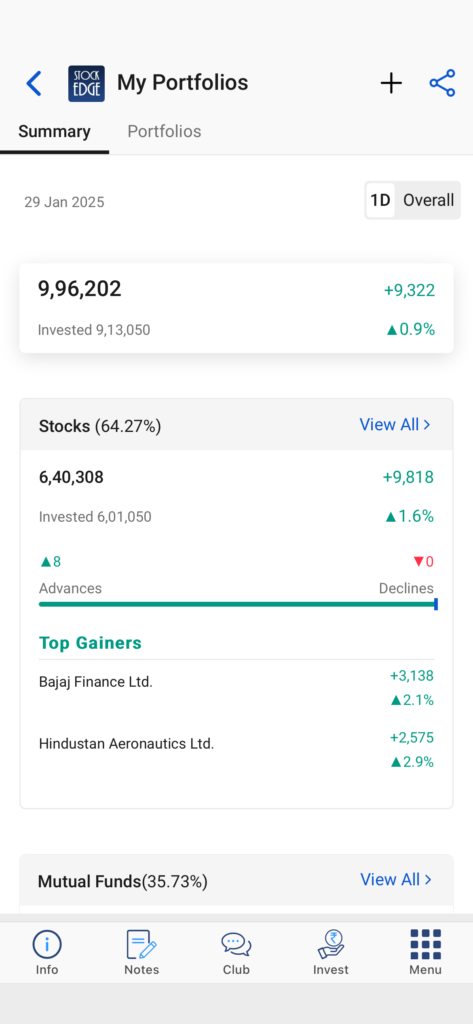
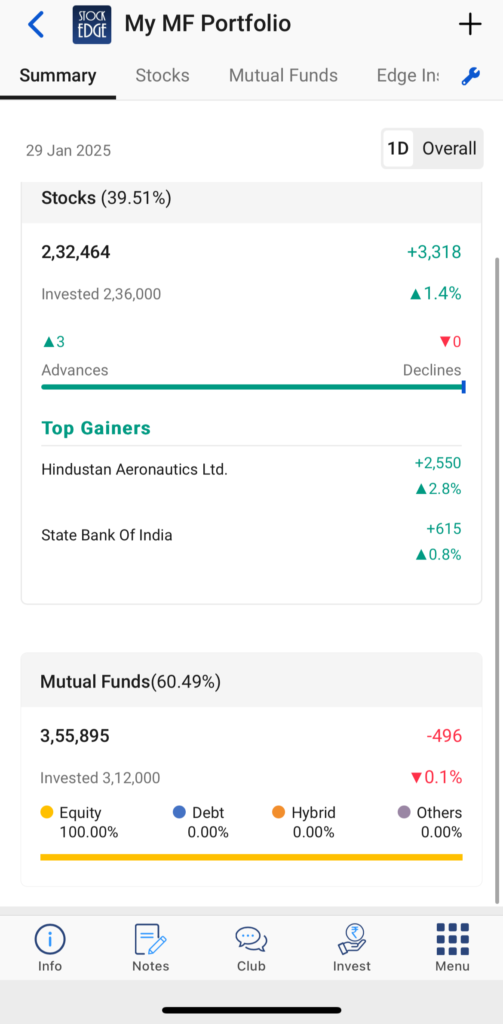
You can also analyze the Summary section, which will show all of the added portfolios, including a separate heading for Stocks and Mutual Funds. The Stocks section shows the Advances and Declines bar for both 1-day change and Overall change in stock prices.
The Mutual Funds section shows the invested amount and the weightage of each asset class (such as Equity, Debt, Hybrid, or Others) within the mutual fund portfolio. It shows the composition consisting of both stocks and mutual funds, sector allocation, market-capitalization allocation, and fund-related news, among many others.
Portfolios
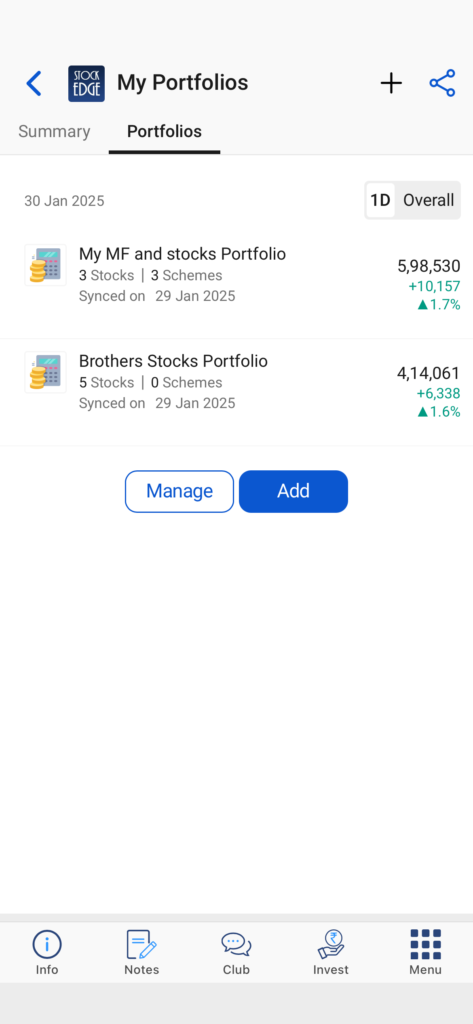
The Portfolio tab shows all the added portfolios and their change in value in the 1-day and Overall timeframes. You can “Add” a new portfolio using the + sign at the top or the Add option below. You can also “Manage” the existing portfolio by deleting, renaming, or adding stocks in the already curated portfolios.
3. MY MF Portfolio
After creating your desired portfolio (here it is “My MF and stocks Portfolio”), under the “Portfolios” section, you can see the Summary page, which is similar to the Summary section Under My Portfolio. You can see the breakup of Stocks and Mutual Funds, along with Edge insights, Sector Allocation, MCap Allocation, Consolidated Holding, Deliveries, Technicals, Chart Patterns, Scans, Edge Reports, News, Announcements, Corporate Actions, Results and Deals.
The page opened is a default setting by StockEdge and users can Customize Tabs according to their preferences. Click on the top right icon besides “Deal” and then click on “Customize” to add or remove any tabs further. After completion click on Save
.
4. My Mutual Funds section
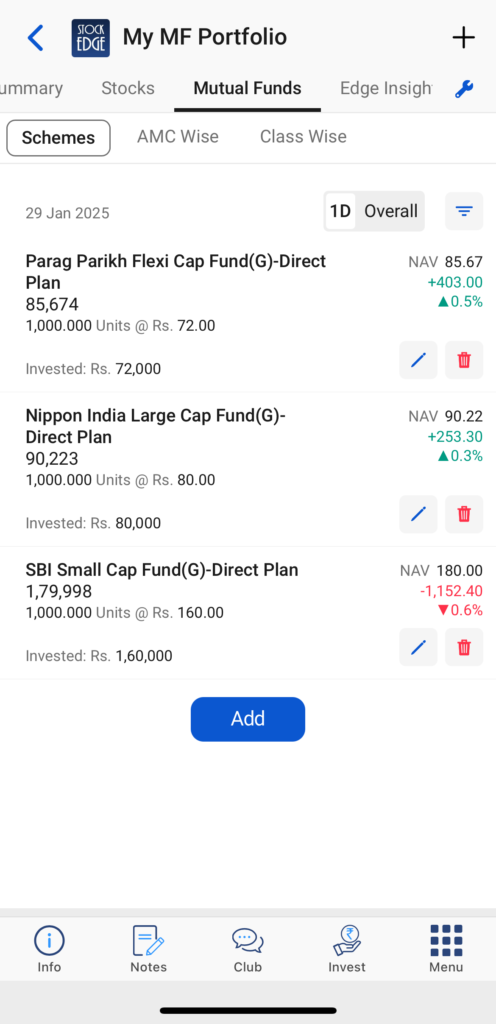
Under the “Mutual Funds” section, you can see three more heads: Schemes, AMC Wise, and Class Wise.
The Schemes tab will show you all the Mutual Fund schemes you have added. You can also sort this by Change in Price, Change in percentage, Current Value, and Invested Value.
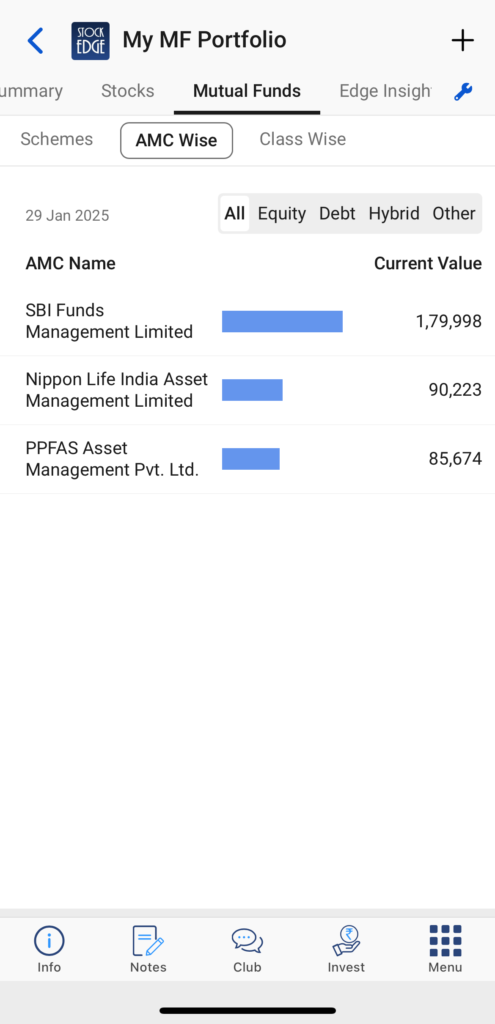
The AMC Wise tab shows your investments from a particular AMC. It is further divided into four options based on Asset allocation: equity, Debt, Hybrid, and Others.
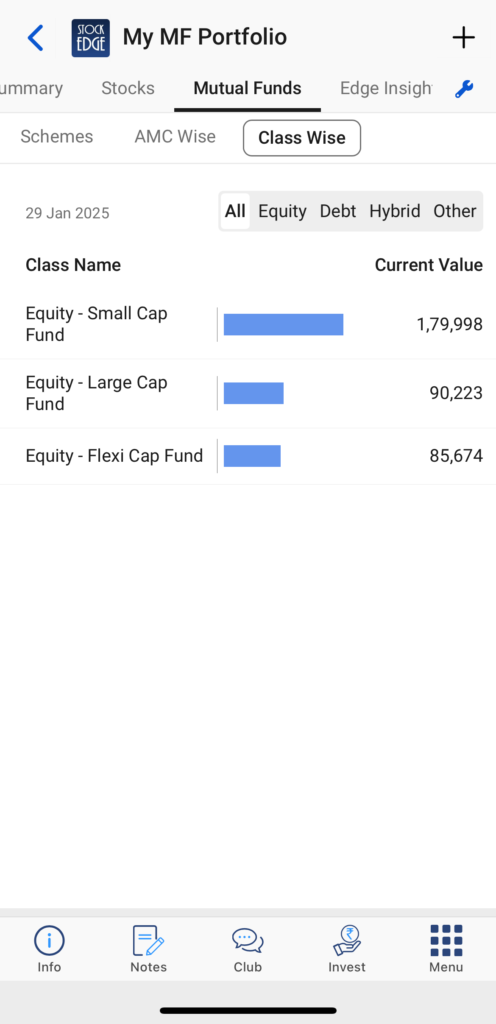
The Class Wise tab displays the mutual fund schemes based on different categories of mutual funds.
5. Sector Allocation
The Sector Allocation section shows the sector-wise exposure of all the Stocks present in that portfolio. At the top right, there is an option of “Include Stocks of Mutual Funds’, when you tick the box, you analyze stocks present in both the demat account and the underlying stocks invested in the mutual fund scheme.
You can also check the pie chart showing the breakup of stocks based on Sector or Industry. Each Sector/ Industry has a separate color, along with its weightage with respect to total Invested Value.
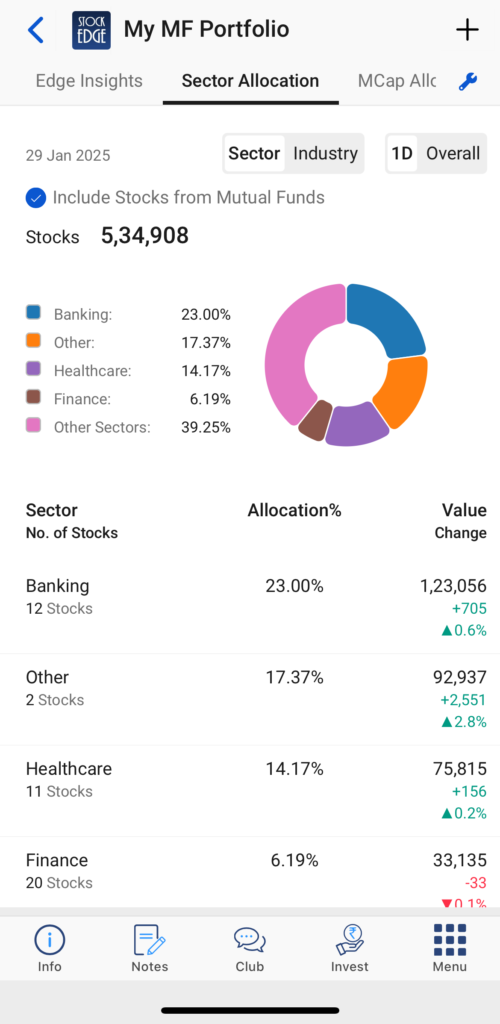
Users can also see the number of stocks present in each sector, the Allocation percentage for each sector, and the Value Change in terms of increase or decrease in 1-Day or Overall Change.
The “Sector Allocation” also shows the number of stocks present in each sector arranged in descending order, with the highest Value Change/ Allocation % at the top.
You can select any “Stock”, and the stock page will open directly. You can further analyze the stock based on Charts, Deliveries, recent updates, Edge Reports, etc.
The MF Holding tab under Stocks will further show a list of Mutual Fund Schemes that have the stock in their portfolio.
6. Market-Cap Allocation
The MCap Allocation section shows the combined allocation of both the stocks and stocks included in MF schemes.
You can also check the pie chart showing the number of stocks, Allocation % and Value change across all market capitalization of Large Cap, Mid Cap or Small Cap.
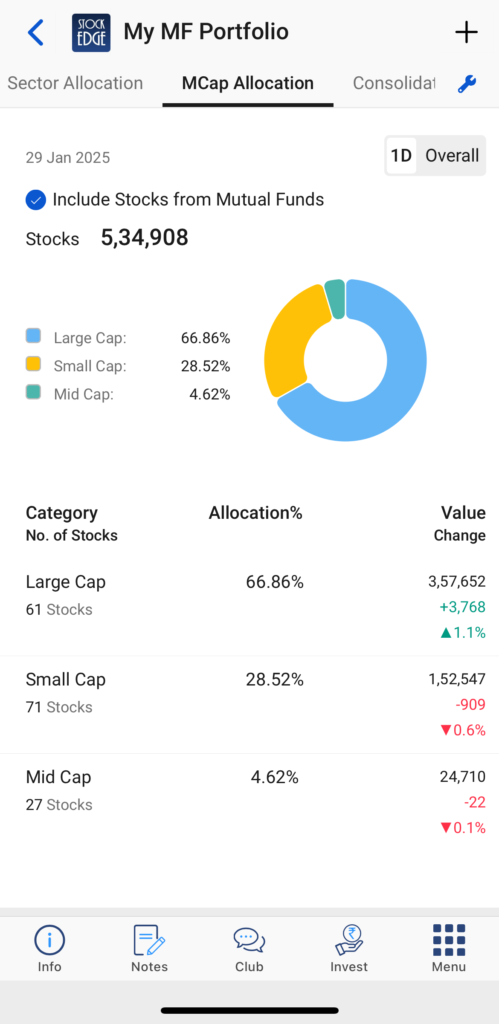
This helps investors figure out their risk profile and the exposure they have in each category. If there are any common stocks or Portfolio Overlap, they will be added, and the total exposure of that stock in the overall portfolio will be visible.
7. Consolidated Holding
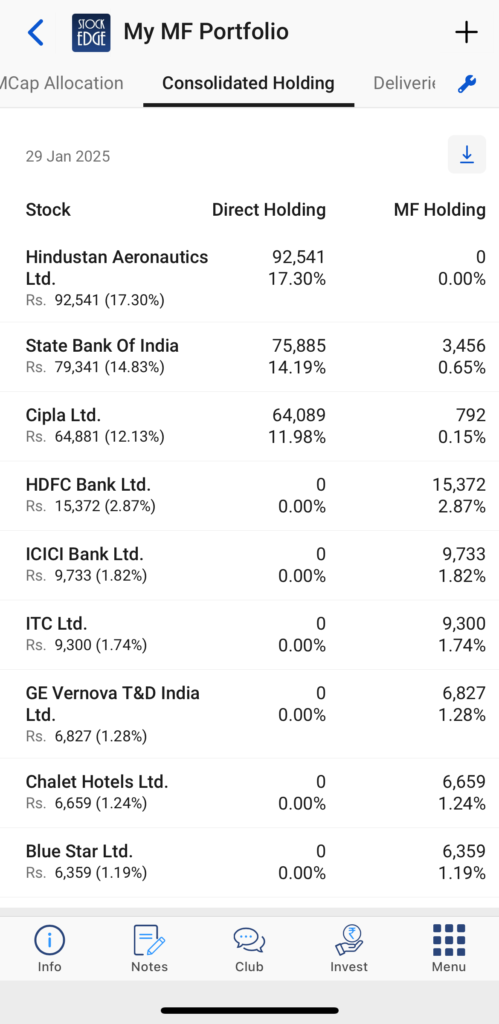
This Section shows all the Stocks that the portfolio holds. It is further divided into Direct Holding and MF Holding, along with the individual weightage of each stock. Stocks with the highest allocation are visible at the top, with the lowest allocation at the bottom.
You may also Download the complete list of Consolidated Holding using the arrow icon visible on the top right.
8. My MF Notes & My MF Watchlists
Within the My MF section, there are two options for Mutual Funds investors:
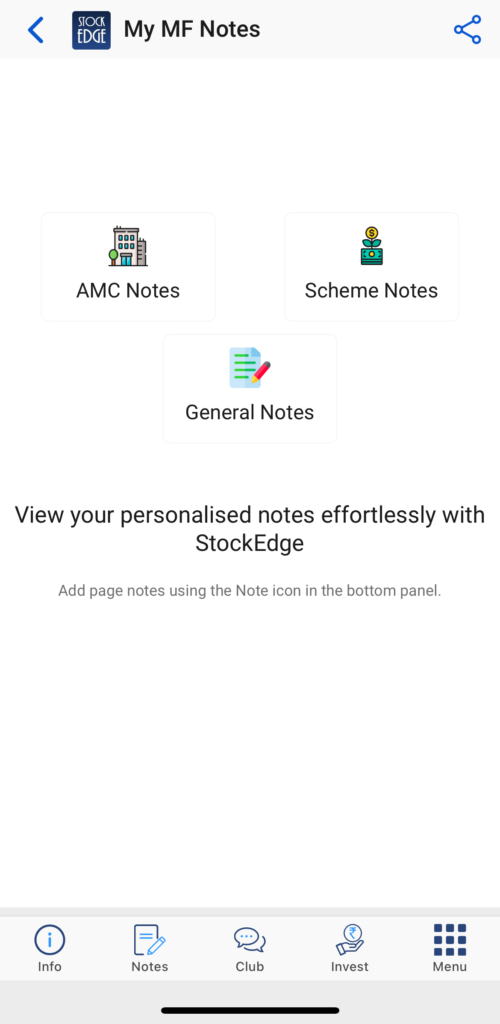
My MF Notes: This Section helps you write any update or fundamental change in the scheme. To add notes in this Section, users should search for the mutual fund scheme they want to analyze and then click on notes from the bottom panel. You can write Notes related to AMC Notes, Scheme Notes or General Notes.
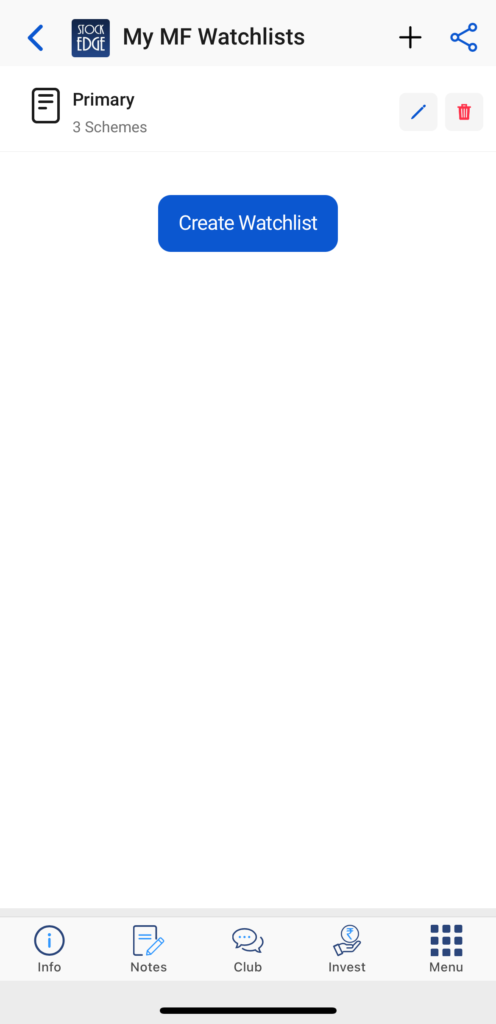
My MF Watchlists: Similar to the Investor Groups, this Section is applicable to Mutual Fund Investors. It helps to track the performance of the particular mutual fund scheme and get insights about it. In the “My MF watchlist”, you will get the list of schemes that you have explicitly added to this watchlist. You will get a list of schemes categorized with their returns for different periods.
Conclusion
My Mutual Fund Section within the My SE app helps investors stay updated about their investments. It combines Stocks and Mutual Fund investments and gives a consolidated view of the investor’s overall holdings. It shows sector-wise allocation and market capitalization weightage across all the investments, which lets investors make the right decision in case of any market downturn or correction.


