Table of Contents
The State Bank of India, commonly known as SBI, is one of India’s largest banks in terms of total assets. The State Bank of India traces its roots to the 19th century when the Bank of Calcutta was founded in 1806. Subsequently, the first joint-stock bank in British India, sponsored by the Government of Bengal, emerged. The Bank of Bombay (established on April 15, 1840) and the Bank of Madras (established on July 01, 1843) were established after the Bank of Bengal. These three banks played a significant role in Indian banking until their merger into the Imperial Bank of India on January 27, 1921.
However, the Reserve Bank of India became the central bank in 1935, diminishing the Imperial Bank’s quasi-central banking role. To adapt to these changes, an act was passed in Parliament in May 1955, leading to the formation of the State Bank of India on July 1, 1955.
Today, State Bank of India is an Indian multinational, public sector banking and financial services company. The SBI share was listed in the national stock exchange (NSE) on 1st March 1995. Since then, SBI share has been a part of the Indian benchmark index Nifty 50.
Get to know the constituents of NIFTY 50.
Company Overview
State Bank of India is a public sector undertaking company. A PSU bank with a strong portfolio of distinctive products & services. Since 1973, the State Bank of India has been engaging in a non-profit initiative known as Community Services Banking. Across the nation, its branches and administrative offices actively support and engage in numerous welfare and social causes. The bank’s role extends beyond just banking, impacting people’s lives in various meaningful ways.
Some of the popular services by the bank include:
- Personal Internet Banking
- Corporate Internet Banking
- Merchant Acquiring Business – POS
- Online Tax / Payment / Receipt / Challan printing
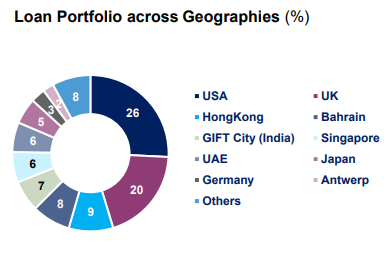
It is truly a multinational bank, as its loan portfolio is spread across geographies. Here is a glimpse of it.
Financial Highlight of the State Bank of India
Bank’s Net Interest Income has grown at 14% CAGR in the last 5 years. During FY23, Net Interest Income grew 20% on a YoY basis. Overhead costs increased on account of rise in business related expenses. Provisions declined substantially which led to a surge in Net Profit.
The net interest income is epitome of its financial performance. It is basically the difference between interest earned from lending and interest paid to depositors. At StockEdge, you can visually see how the NII of SBI has been increasing over the years.
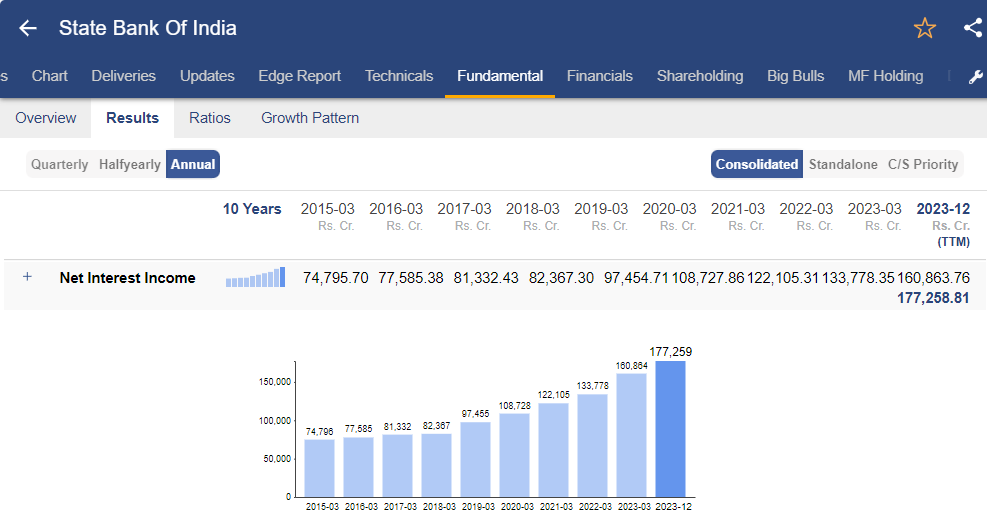
The annual net interest income of SBI has been increasing at a steady pace.
Return Ratios improved to some extent. Net Interest Margin increased, but Cost to Income Ratio grew.
We have a dedicated tab in StockEdge where you can view the financial ratios of any company.
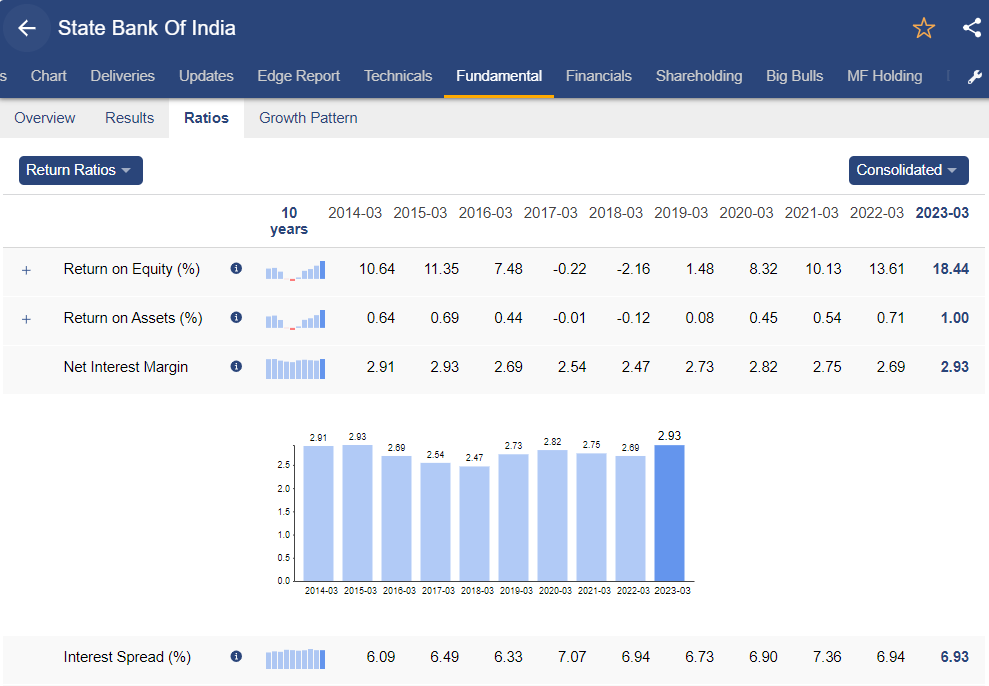
As you can see in the above image, the return ratios of SBI share, ROE, ROA, along with the net interest margin (NIM) of SBI, are displayed as a bar graph for easy interpretation of the financial data of the stock.
Domestic Advances increased by 15%, supported by the growth of Retail & SME Advances. Foreign Advances also grew by 20%.
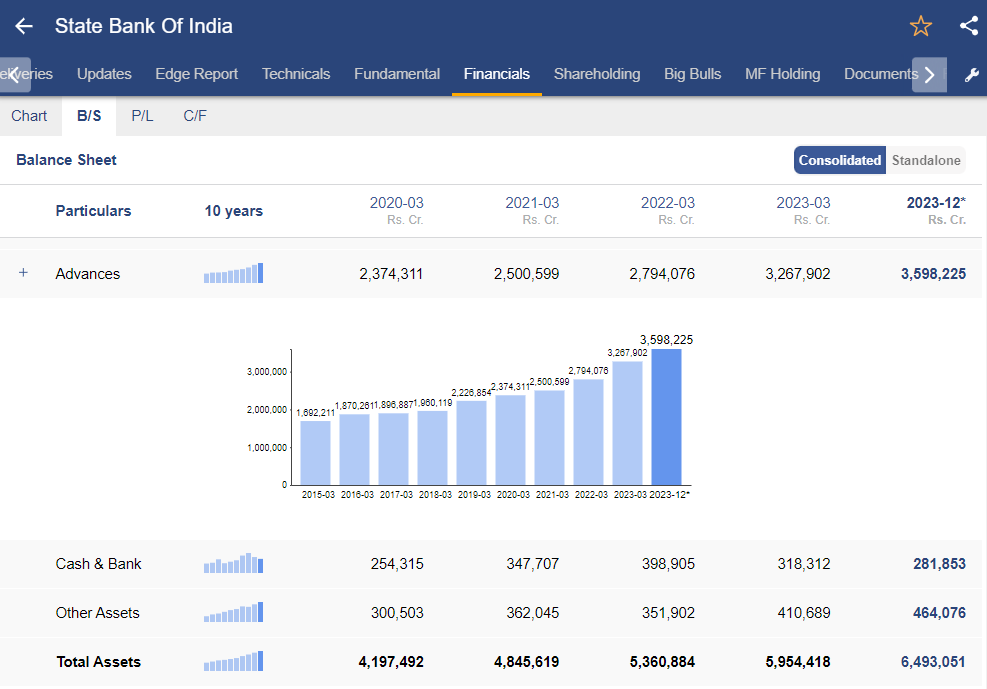
The annual growth in advances or loan books of SBI has been steadily increasing. Click here to further understand the growth of advances in SBI’s balance sheet.
As per Loan Mix, the majority of sectors are:
- Home Loans-23%
- Infrastructure-13%
- Services-13%
- Agriculture-9%
Yield on Domestic Advances improved sequentially, however Yield on Foreign Advances declined. Yield on Investments slightly increased. The asset quality has improved as compared to previous quarters and Gross NPA Ratio & Net NPA Ratio declined by 119 bps YoY and 35 bps YoY respectively to 2.78% and 0.67%.
Total Deposits increased by 9% on YoY basis. CASA growth stood at 5% supported by a rise in Term Deposit balance. Term Deposits which occupy more than 56% of the Domestic Deposit balance, witnessed 11.4% rise in the deposits. Cost of Domestic grew 9bps on QoQ basis but Cost of Foreign deposits increased 34bps sequentially.
Q3 FY24 Financial Update
The company reported a Net Interest Income of ₹44,776.4 crore, marking a growth of 6.2% YoY. However, the net profit witnessed a decline of 28%, amounting to ₹11,282.7 crore. Adjusting for exceptional items totalling ₹7,100 crores, the standalone net profit for the quarter stood at ₹9,164 crore. Amidst the challenges of rising interest rates, NIM declined 28 bps YoY to 3.22%, and the cost-to-income ratio stood at 60.34%. Total advances reached ₹35,84,252 crore, with total deposits amounting to ₹47,62,221 crore, rising 14.38% YoY and 13.02% YoY respectively.
GNPAs and net NPAs are very popular indicators for analyzing a bank’s asset quality.
In the latest quarter, the bank’s asset quality improved, with gross non-performing assets (GNPA) and net non-performing assets (NNPA) declining by 72 basis points and 13 basis points respectively.
SBI witnessed credit growth across all segments, particularly in retail loans, which increased by approximately 15% year-on-year (YoY). The bank’s domestic advances growth was driven by a rise in SME loans by 19% YoY and agricultural advances by 18% YoY. Furthermore, deposits increased by 13% YoY, with domestic CASA deposits forming around 41% of the overall domestic deposits.
SWOT Analysis of SBI share
We’ll conduct a SWOT analysis of the company to gauge its strengths, weaknesses, opportunities, and threats. This analysis will provide insights into the company’s competitive position and potential risks, aiding in making informed investment decisions.
Strength
SBI is the largest public sector bank in terms of assets, deposits, branches, number of customers, and employees with pan-India presence. SBI has demonstrated a strong improvement in asset quality, while Provisioning Coverage Ratio (PCR) increased to 76%.
PCR is the percentage of funds that a bank keeps aside for losses due to bad debts.
The market share of SBI in home loans and auto loans stood at 33.1% and 19.4%, respectively. It holds a substantial market share in deposits. The bank’s subsidiaries also hold significant market share in their respective fields.
The bank holds a 22.99% market share in Total Domestic Deposits and a 19.68% share in Total Domestic Advances. SBI Card enjoys market share of 26.25% for Debit Cards Spends and 22.83% in Mobile Banking Transactions. SBI ATMs market share stood at 29.9%.
Weakness
SBI encountered several challenges during the quarter, including the impact of exceptional items on its net profit and the increase in operating expenses. Additionally, the slippage ratio increased by approximately 17 bps YoY to 0.58% in Q3 FY24, reflecting a slight deterioration in asset quality. Furthermore, the restructuring book, although reduced compared to the previous year, remained substantial at ₹18,880 crore, indicating ongoing concerns regarding asset quality. These factors pose potential threats to the bank’s profitability and capital adequacy in the future.
Opportunity
As the bank witnessed muted growth in current account deposits, it will be focusing on this segment for further CASA growth. The management of the bank will explore opportunities through cross-selling & forex income and plans to capitalize on the same. As the capex cycle is expected to boost the banking sector, the bank will have immense opportunities to increase its advances. Loan growth for the bank is expected to be in the range of 14%-15%. The bank intends to retain NIMs around 3.5% for FY24.
It is planning to increase its cross-sell income to ~₹8,000 crore from ~₹3,641 crore currently. However, the bank acknowledges the impact of the wage revision, expecting staff expenses to increase by approximately ₹500 crore per month in FY25.
Threat
A huge rise in the Repo rate by RBI will affect the cost of funds and increase the rate of interest for borrowers. This might impact the advances in growth.
The Bottom Line
Looking ahead, SBI anticipates stable net interest margins for FY24 and envisions credit growth of around 14%. However, the revision in the wage bill is expected to incur an additional cost of approximately ₹1,200 crore per quarter. The overall outlook remains strong for the long term.


