Table of Contents
In technical analysis, there are more than 100+ popular indicators which can help you make decisions to buy, sell or exit stocks while trading in the market. One such indicator which was developed by J. Welles Wilder in 1978 is the Average Directional Movement Index or commonly known as ADX indicator. It determines the strength of a trend in any particular stock at a given point in time.
In this blog, you can learn how to use the ADX indicator for swing trading. As swing trading seeks to capture short-term price gains over a period of days or weeks, ADX indicator could be the best possible technical indicator to identify strong price actions moves within a short-span of time.
Introduction to ADX Indicator
A technical indicator developed by John Welles Wilder that determines the strength of a trend in a particular stock or any other financial instrument. ADX indicator does not indicate the direction of a stock but only the strength of the trend. In the simplest way, the ADX indicator determines whether the stock is trending or not.
Components of ADX Indicator
It is a combination of two indicators developed by Wilder, which are:
- The positive directional indicator (abbreviated +DI) and
- The negative directional indicator (-DI)
The ADX combines the two and smooths the result with a moving average.
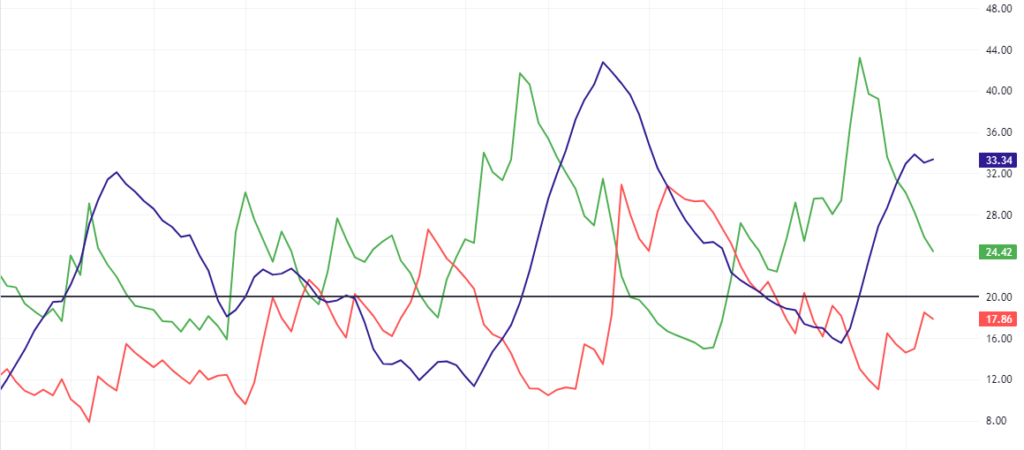
In the above image, you can see three lines, the violet line represents the smoothed average of +DI and -DI. The green line represents the +DI whereas the red line represents the -DI.
But what does +DI or -DI indicate?
Let’s take an analogy to understand the roles of +DI and -DI along with ADX. Think of +DI as the forward gear of your car and -DI as your reverse gear, where ADX is the accelerator to decide how fast you want to move forward or backwards.
Hence, the +DI line indicates the strength of the positive movement, whereas the -DI indicates the strength of the negative movement.
Although ADX is a lagging indicator, meaning that a trend has already been established before the index can generate its signal. The objective of the Average Directional Index (ADX) indicator is to find out whether the stock is trending in a direction or consolidating in a range.
Calculation of ADX Indicator
In the simplest form, let’s first understand +DI and -DI.
Directional movement is DI+ when the difference between the current high and the prior high is greater than the prior low minus the current low.
Directional movement is DI- when the difference between the prior low and the current low is greater than the current high minus the prior high.
However, when the difference between them is negative, it will be entered as 0.
The +DI indicator is 100x the exponential moving average (EMA) of +DI divided by (ATR), which is the average true range for a set number of periods (typically 14 days). The -DI is 100x the EMA of -DI divided by the ATR.
The ADX indicator is 100x the EMA of the absolute value of positive DI minus negative DI divided by +DI plus -DI.
Hence, the formula is ADX = 100 × ( +DI minus -DI) / (+DI plus -DI) / ATR
How to interpret the ADX indicator?
The ADX indicator oscillates between 0 to 100. The higher the ADX value, the greater is the strength of a trend. It does not necessarily mean that higher ADX value means the strength will be in an uptrend, rather it defines the strength of trend either up or down. But how strong is the strength depends on the value of ADX.
- ADX below 20: Non-trending or consolidating.
- ADX crosses above 20: A new trend may emerge.
- ADX crosses 25: Confirmation of the trend.
- ADX above 40: Strong trend.
- ADX crosses 50: Extremely strong trend.
- ADX crosses 70: A rare occasion.
Let’s’ take an example:
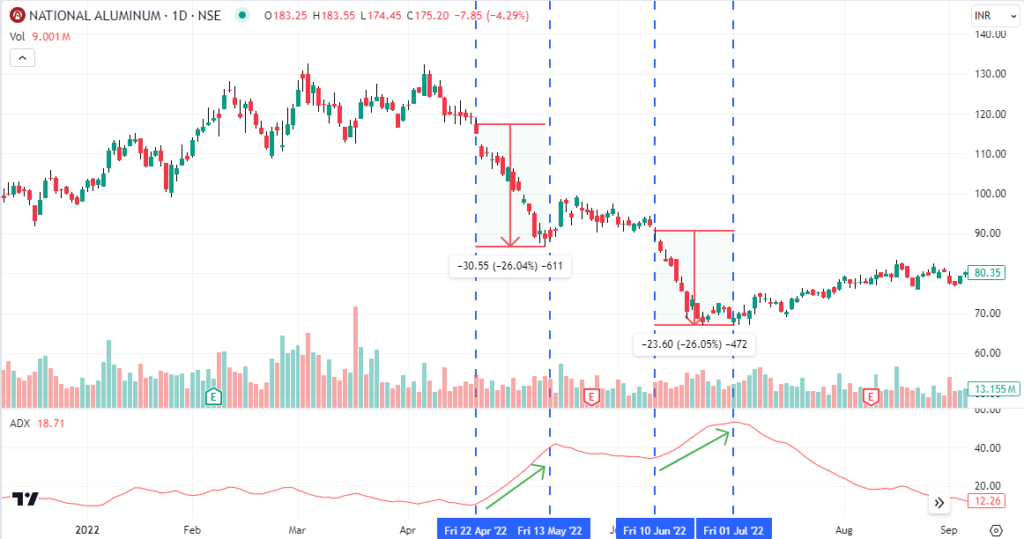
As you can see in the above chart of National Aluminium Ltd. on a daily time frame, whenever there is a sharp rise in the ADX indicator or the value or ADX rising sharply, the stock price declines heavily. In contrast when there are no major moves, stock prices are range bound ADX value tends to drop indicating losing strength.
Therefore, for swing traders, ADX is most likely the best technical indicator that can help them get the maximum return in the shortest span of time.
In the above example, you can see the stock tanked nearly 26% within 14-15 trading sessions.
Although analyzing just the ADX indicator can indicate you about the strength of the trend, but not the direction of it. So, to identify the direction of the strength, one can apply +DI and -DI which will also suggest the direction of the trend.
Swing Trading Strategies using ADX Indicator
There are multiple ways that you can use the ADX indicator for swing trading. The simplest way is to analyze the value of ADX. By default, ADX above 20 indicates the starting strength of a trend. However, in this case, let’s consider ADX crossing 25, which suggests confirmation of an emerging trend. So, whenever ADX crosses 25, it suggests a strong trend is about to remain for a while.
Now, let’s apply the +DI and -DI, which will determine the direction of the strength.
So, when +DI is going up, it indicates a rise in stock price and when -DI is going up, it indicates a fall in stock price. Moreover, by virtue of the set-up, when +DI is going up, then -DI will go in the opposite direction and vice versa.
Here is an example:
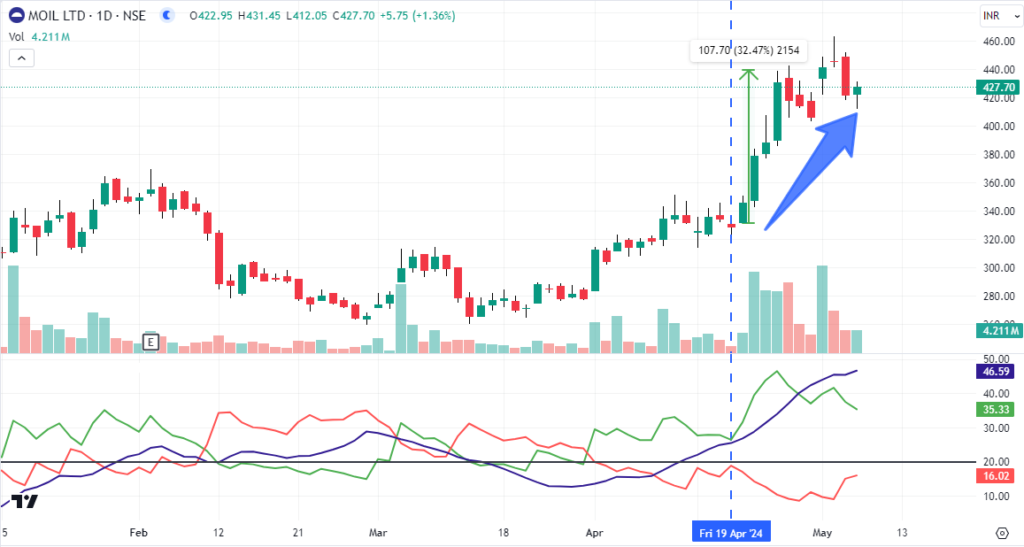
This is the daily chart of MOIL Ltd. On 19th April 2024, ADX value crossed 25, and +DI was also trending up, crossing the value of 25, which resulted in a sharp rise in stock price, gaining nearly 32% in just 4 trading days. But when to exit the trade? For that, you can either have a price-based stop loss or indicator-based stop Loss based on your risk appetite.
But the question is, how can such stocks be filtered out for swing trading? The StockEdge app has the answer to it.
Scan Stocks Using StockEdge
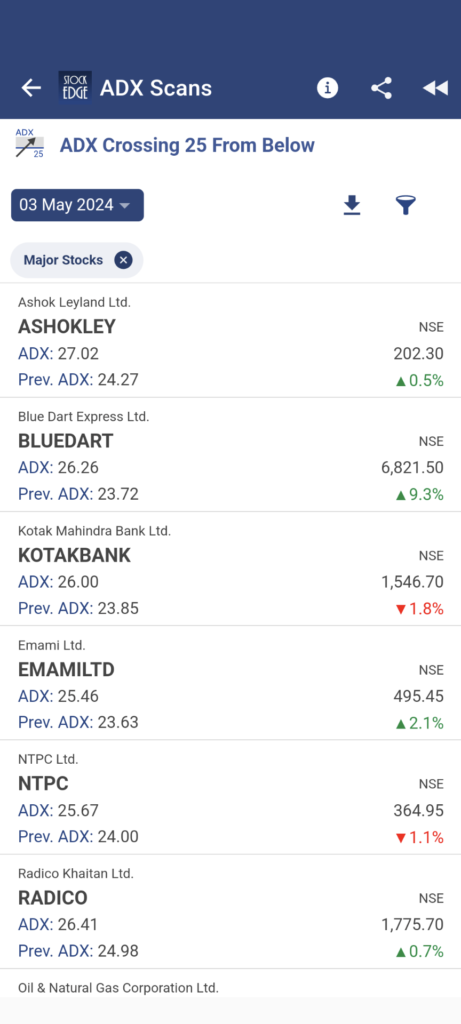
StockEdge is the best stock market app to filter out stocks based on several technical or fundamental factors. We have dedicated technical scans to identify stocks where ADX is crossing above 25.
Isn’t is fantastic, with just a click you get the entire list of stocks where ADX crossed 25 on a particular day. Now you need to analyze each stock from the list to identify a perfect set-up where +DI has been in an uptrend and vice versa -DI is going down.
One such stock is Emami from the list, where ADX has crossed 25, whereas +DI is trending up and -DI is going down.
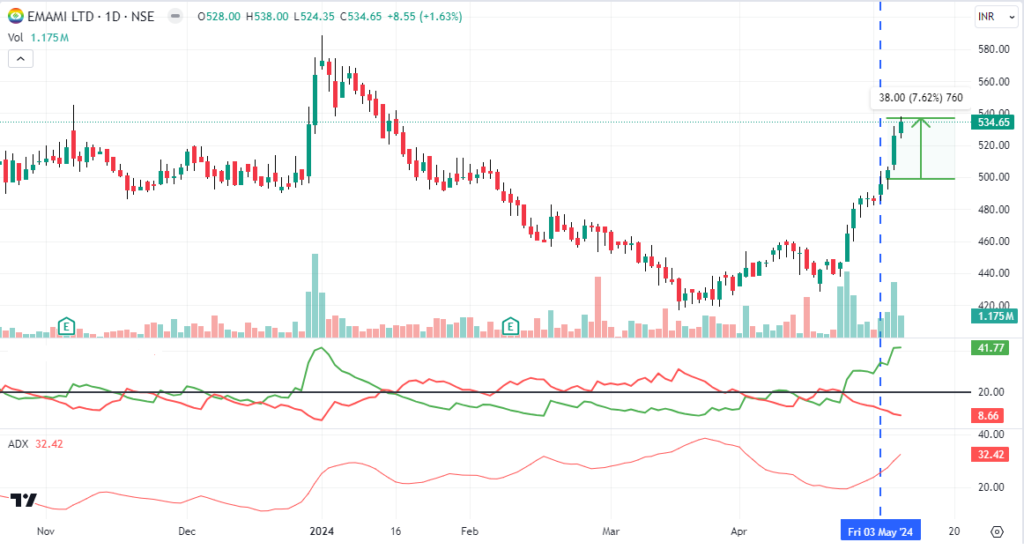
As you can see, the stock gained more than 7% in just three trading sessions and has the potential to go further up based on the ADX strategy.
The Bottom Line
For swing traders, ADX indicators can be a very good signal to identify stocks with strength, which suggests you can get the maximum return in the shortest span of time.
Start using StockEdge to scan stocks using the technical scan ADX crosses above 25 from below and then analyze the price chart to identify a probable trade. ADX is a lagging indicator, so follow price action movements of the stock because, as we know by now, in the stock market, “Price is supreme” or commonly, as we say, “Bhav Bhagwan hai.”‘
Also, to know more such swing trading strategies, you can read: Top 3 Swing Trading Strategies for Beginners
Happy trading!


