Table of Contents
In order to find out whether it’s an undervalued stock or an overvalued stock, you need to understand valuation. So, what is valuation?
Simply, finding a price an asset should trade at today, irrespective of what the market quote is. Once you reach the valuation price point, simply buy if the stock is trading below the value or sell when its trading higher than the value.
Well, this is the ideal world. But,
I have often heard many people say, “Valuation is often not a helpful tool in determining when to buy or sell hyper growth stocks”.
Well, they generally go missing when something like this happens.
Paytm or One97 Communications was listed at a very expensive valuation of INR 1600. However, markets soon realised the hefty premium valuations and hammered the stock to a low of INR 300.
Hence, whether we believe it or not, valuation plays a role when we invest in the stock market.
But how will you determine whether the 1600 (Paytm) price was expensive or not? Well, read through this blog as we take you on the journey of identifying undervalued stocks.
Table of Contents
What are Undervalued Stocks?
Stocks that are trading below their “intrinsic value” are called as undervalued stocks. Intrinsic, as the name suggests, is the true value of a company. It is the basis of measuring the undervaluation or overvaluation of a stock.
How to Measure Undervalued or Overvalued?
As discussed above, finding a company’s intrinsic value is the basis for determining whether it’s an undervalued stock or an overvalued stock. The process of determining the intrinsic value is called “Valuation.”
Valuation is a mix of story and numbers. It cannot be entirely based on numbers.
Let’s say I was valuing Apple in the early 2000s. At that time, it was just a company manufacturing computers. If I were to value Apple just on the basis of those numbers without using any of my imagination and story, I would be valuing it just as a PC manufacturer with a market size of just a few billion $. If I could use my imagination and vision, which is supported by management commentaries and vision, I would rather see Apple as a tech company, a sector with a market size in excess of $5 trillion. You see, when I move on from a PC manufacturer to a tech company, the market that Apple will be catering to grows many folds.
So, if you regard yourself as a quant guy or a number person, sorry to say, you’ll probably be missing out on many of the futuristic stories that are in development.
But hold on, a valuation cannot be based on just a story.
How would this sound if I said I could buy Zomato at any price? It’s a global company, and its target market is the entire world population. Well, it’s good to be optimistic, but it’s even better to be realistic. Today, Zomato serves just 2% of the people who consume restaurant foods in India. On the one hand, it depicts opportunities, while on the other hand, it also states that the future will entail a lot of investments to gain market share, a lot of competition and other risks that are present in the tech industry.
There are other factors, such as Indians’ genetic habit of consuming more home-cooked food.
Also, about being a global company, remember what happened to Uber Eats in India?
So hey, I am not saying that they can’t make it big; I am just saying that a lot of it might already be priced in the 1,00,000 cr market cap on the listing date itself.
Most Used Valuation Techniques
Valuation can be broadly categorized into:
1. Relative Valuation
As the name suggests, in relative valuation, rather than valuing a company based on its intrinsic characteristics, we value it based on its comparables in the market.
This type of valuation is actually valid for any market you can probably think of.
Say, a vegetable seller, A, is providing potatoes at 20 rs per KG while vegetable seller B, just next to it, is selling them for 25 rs per KG. Until and unless there are differences in the quality of the vegetable, you would say that Vegetable Seller B is more expensive than A. Hence, you would buy A.
Similarly, in the real estate market. You determine the cost of a flat based on the prices per square foot for other flats in the same building or area.
Similarly to the vegetable seller example, we assume that the two flats we are comparing are similar in nature.
However, if, say, the other flat you were comparing was situated in a building with a swimming pool, this increases the utility for the flat owners, and hence, they might be interested in paying a premium.
Therefore, in relative valuation, we need to compare apples with apples, not oranges.
There are various matrices that are used in relative valuations to derive both Equity Value and Enterprise Value.
Some of these are Price to Earnings, Price to Book Value, EV/EBITDA, and PEG Ratio.
- Price to Earnings (PE): This is calculated by Dividing the stock’s price by its Earnings per Share (EPS). The PE ratio can evaluate mature companies with stable earnings. Companies posting losses can not be evaluated via the PE ratio. Undervalued stocks generally have a lower PE ratio than their sector average.
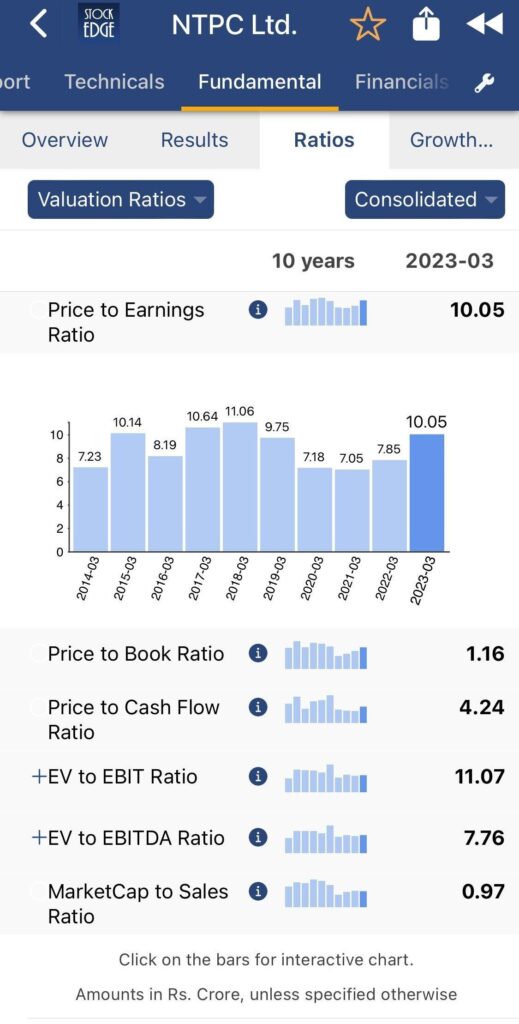
For example, NTPC is currently trading at 368, while the EPS is at 21.46. Therefore, the PE of NTPC is 368/21.46 = 17.15x.
In Stockedge, you can find the historical PE of the stocks as well, to find out if it is an undervalued stock.

- Price to Book Value: The net assets of the company, is also called as Book Value. Market Price divided by the book value (BV) gives us the valuation matrix, Price to Book Value. Asset heavy companies or Banks are evaluated via PB ratio. Undervalued stocks generally have a lower PB ratio amongst its sector averages.
For Example, the per share BV of HDFC Bank is at 596.59, while the market price is 1597, hence the P/BV is 1597/596.59 = 2.68x. You can find out the per share BV on stockedge.
- EV/EBITDA: EV or the Enterprise Value is the total Value of the company as calculated as Market capitalization + Preference Stock + Outstanding Debt – Cash & Cash Equivalents. EBITDA is the Earnings before Interest, Tax Depreciation and Amortization. EV divided by EBITDA gives us EV/EBITDA, which is an important matrix for evaluating undervalued stocks. Comparing debt-burdened or cash-surplus companies can be done via EV/EBITDA ratio. Also, companies that are posting losses on the net profit levels but are profitable at the operating level can also be gauged as undervalued stocks by looking at EV/EBITDA rather than the PE ratio. Undervalued stocks generally have a lower EV/EBITDA than their competition.
For example, Sterlite Technologies has posted a net loss in the last four months and can, therefore, be valued via the PE ratio. Therefore, we look at its EV/EBITDA.
Find the historical EV/EBITDA ratio on Stockedge.
- PEG Ratio: The PEG ratio is short for the PE to growth ratio. This is used to value high-growth companies. It’s a known fact that high-growth companies, like energy, solar and tech stocks, generally trade at a higher PE ratio. This makes it difficult to find undervalued stocks in these high-growth sectors. Hence, Peter Lynch introduced a measure called the PEG ratio, which helps investors to find undervalued stocks in high-growth sectors. Divide the PE ratio by the EPS growth of companies to get the PEG ratio.
For example, the PE of Adani Green is 227x while the 3-year EPS growth stands at 68%. Therefore, the PEG ratio is 227/68 = 3.33x; now, to find whether it is undervalued stocks, compare its PEG ratio with other peers.
Intrinsic Valuation
In this type of valuation, there is scope for counting in both the numbers and stories in the valuation picture. Warren Buffet says the price of a stock is nothing but the present value of all the future cash flows. Hence, we try to estimate the future cash flows from stocks and discount it to the present to capture the true value of the company. Discounting the cash flow is a time value of money concept. The further the cash flow, the lower its value. It is for this reason that FD rates are higher than savings account rates, as people want compensation for getting money after a fixed interval of time. The value hence calculated is companies with the current market price of the stock to evaluate if it is an undervalued stock. The most popular relative valuation techniques are listed below:
Dividend Discount Model
Investors love dividends. A company’s EPS is basically divided into two parts: one is the dividend paid to the shareholders, and the other is the retained earnings.
The attractiveness of dividends is based on the concept of time value of money. Hence investors would like to have a dividend today if the company is generating a lower return on the retained earnings.
In the case of DDM we discount the dividends at the cost of equity capital.
We use DDM for stable companies that are already generating free cash flow in order to distribute it among the shareholders.
Discounted Cash Flow (DCF)
In this approach we try to estimate the free cash that the company will be able to generate in the future.
There may be two types of free cash flows that the investor can estimate, the first one is the free cash flow to the firm which is the cash that is available to the entire firm, the equity holders and debt holders. In any type of DCF you require a discount rate. In case, when we are estimating the value of a firm via FCFF, we will discount it via the weighted average cost of capital which includes the return demanded by both equity and debt holders.
The second type of free cash flow is the Free Cash Flow to Equity (FCFE). It is the cash that is available to the equity holders only. Since we have the cash to equity, therefore the discount rate should also be for the equity holders only and hence we use Cost to Equity, which is nothing but the required return by the equity shareholders to discount FCFE.
This method can be used practically for any type of company, be it an early-stage startup, high growth company or a mature company. However, we cannot use the free cash flow approach in the case of financial sector companies which include banks, insurance companies, AMCs, etc.
Risk & Reward of Investing in Undervalued Stocks
Key Factors to consider before investing in Undervalued Stocks
As per my analysis, say a company should trade at INR 1300 today. However, the CMP is 800. So, it is highly undervalued. It should be trading at 1300 but was available at just 800. Does this mean as and when I buy it the share price would jump to 1300? No. The intrinsic value and the market value will match when
- Markets perception about the company improves
- Management is able to showcase its potential and keep growing the company
- Finally, the equity markets of the country are also doing well.
If the share price is lower than this value today, it’s great news. As an investor you should be happy that you are getting the company at a cheaper price.
If the share price is higher than this value. No problem, we’ll wait for the right price to get into the company. The lower you buy from the value, the higher is your margin of safety. So, if I define my margin of safety as 10%, I should buy the company only when it is trading at a 10% discount to the intrinsic value.
But what if the price is trading higher than the value and you already own the share. Should you sell? Well theoretically yes! But practically, it depends on the company.
Charlie Munger was quoted as saying in the book “Poor Charlie’s Almanac” that the rules of buying and selling are different. An extraordinary company, if purchased at a right price, should not be sold just as it becomes overvalued. This is because an extraordinary company can do miracles. Who knew, thereby you should hold on to your winner, till the time you think that it is wildly overvalued. I take a threshold of 2x my intrinsic value.
However, I might not buy at an overvalued price. Make it a rule, buy only if you get the company below the fair value or at best at the fair value. For selling, wait for it to become highly overvalued if it’s a great company. For a mediocre company, you may consider selling it at fair value as you will keep getting chances of catching it again below the fair value sometime in the future.
Why do investors prefer undervalued stocks
A stock’s return can be bifurcated into
- Growth in the net profit of the company
- Growth in the PE ratio of the company
Nifty gave a return of 12% CAGR from 2015 to 2023. You’ll be surprised to know that out of this return, when bifurcated, just 7.8% was due to EPS or net profit growth, the rest was contributed by the PE re-rating.
Let’s take another example. This was a study conducted by Venture Capitalist and Investor, Ajay Sharma, showcasing this in the Face2Face with Vivek Bajaj. In the year 1970, US also had a list of top 50 companies, called Nifty50 (not the Indian Nifty50). Here is a list of those companies.
Source: https://www.youtube.com/watch?v=jeHWEX1JP0o
Recognize, McDonalds was trading at a PE of 72x, similar to the PE of Disney. Both of these companies along with all the other companies that were trading at a PE higher than S&P 500 (30x). Over the next 24 years, the companies with PE lower than 30x, outperformed the S&P 500 and the others underperformed.
Therefore, for long-term investing, entry multiples matter!
Identifying Undervalued Stocks
Qualitative Analysis
Since now we have a basic understanding of valuations, lets now dip into the more important concepts of valuation. It’s a known fact that markets run on sentiments. As discussed earlier, valuation is a sum of numbers (quantitative analysis) and story (qualitative analysis).
The qualitative analysis to find undervalued stocks can be performed in the following ways:
Management Quality
Management of the company can decide the future trend of growth. A quality manager is one who thinks about the capital allocation towards the long-term growth of the company. A good capital allocation skill can be learnt from the instance that Warren Buffet closed down a profitable running Textile company called Berkshire Hathaway and directed its cash flows towards acquiring other long term growth businesses such as insurance and food and beverages, simply due to the fact that textile business is a cyclical business with no strong moat. A company with better management skills, can be seen trading at a premium to other companies in the same sector.
Corporate governance
Promoters of the company should ensure transparency, accountability and ethical business practices that increase the shareholder value over time. Diversity of the board is also a factor that ensures good corporate governance. A company with good corporate governance practices is expected to trade at a premium to the sector. For example, MNC companies are seen to trade at a premium to other Indian promoter run companies due to set corporate governance practices.
Moat
A company that has durable competitive advantages should trade at a premium to other competitors or the general market. This makes certain overvalued companies, undervalued stocks, if looked from a qualitative angle.
Michael Porter’s 5 force Model can be used for qualitative analysis of companies in order to pick undervalued stocks. The following 5 forces are lower the better: threat of new entrants, competitive rivalry, bargaining power of buyers, threat of substitutes, rivalry amongst the existing competitors and bargaining power of suppliers.
Quantitative Analysis
We have already discussed the various methods (quantitative) of finding undervalued stocks. Few of the discussed ones are:
- PE ratio
- PB ratio
- EV/EBITDA
- PEG ratio
- Dividend Discount Model
- Discounted Cash Flow Analysis
Apart from the ones discussed, investors have found out that various other forward measures can also be evaluated to find out undervalued stocks. For example, considering 1-year forward earnings as the denominator for the PE ratio, gives us the forward PE ratio. This is useful to find undervalued stocks in a fast-growing industry.
Finding Undervalued Stocks using StockEdge
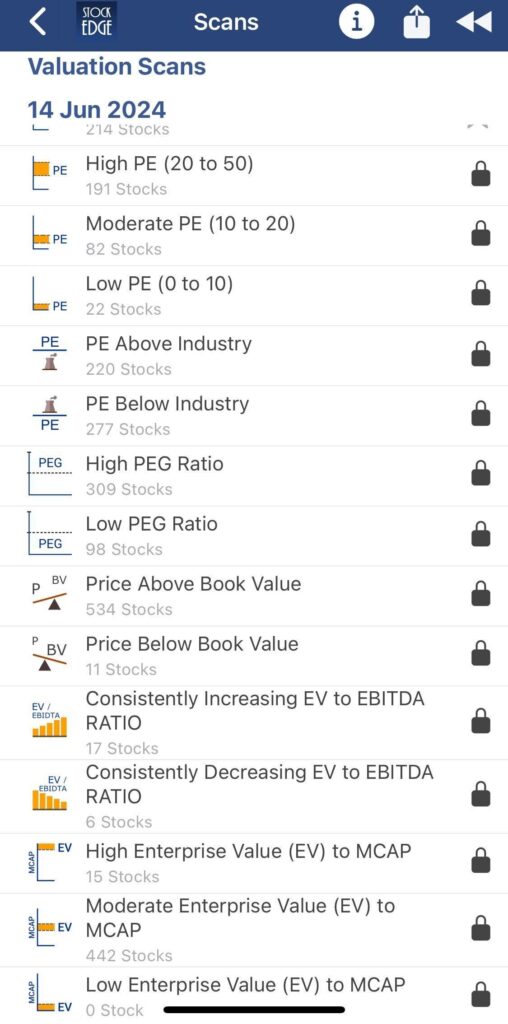
StockEdge provides users with ready scansto find out undervalued stocks. Few of them are listed below.

Users can make effective use of features such as low PE, low PEG ratio to find out undervalued stocks. Similarly, StockEdge has made available a feature to locate stocks that are not undervalued currently but due to price correction/ fundamental improvements are entering the undervaluation zone. For instance, check the constantly decreasing EV/EBITDA ratio scan.
Case Study
Investing in undervalued stocks has historically been very profitable for investors. Take the example of very popular competitors – CocaCola and Pepsico.
In the year 1972, Coke used to trade at a PE of 48x, while Pepsi used to trade at a lower PE of 30x. Over the last 40 years Pepsi has outperformed Coke by a margin of at least 2-3% each year. The 40-year CAGR stands at 11.42% and 9.98% for Pepsico and CocaCola respectively. Lets see if the same works in recent times as well.
Blue: Pepsico Red: CocaCola
NTPC
NTPC is a government of India company that is into the energy sector – producing power both through renewables and thermal options. The company last year was into the Low PE (0-10) scan. Investing into the company at a low PE of 10x as of April 2023, could yield significant returns for investors as the stock has moved from a price of 180 to 350+ in a matter of 1 year. The current PE of the company stands at 17x.
Similar to this, investors can look into stocks via the StockEdge app to find undervalued stocks.
Conclusion
In the current bull run, it is easy to get swayed by the sharp rally in some of the sectors such as Defence sector stocks, PSU Banks, Railways, etc. In this scenario, it becomes even more important that investors understand the importance of valuation and its role in long term equity returns.
Time and again, the market has proved to us that investing in undervalued stocks is the key to make sustainable returns in the equity markets – whether its global or Indian equity markets.
Happy Investing!


