Table of Contents
Technical analysis is a combination of art and science, and “Classical Chart Patterns” proves it very well. Basically, chart patterns are graphical representations that are formed due to certain price action movements of a stock in a particular time frame. These chart patterns, when formed on a particular time frame, generate a trading signal. One such popular chart pattern is Flag patterns. In this blog, you will learn how to identify and trade flag patterns.
Introduction: Flag Patterns
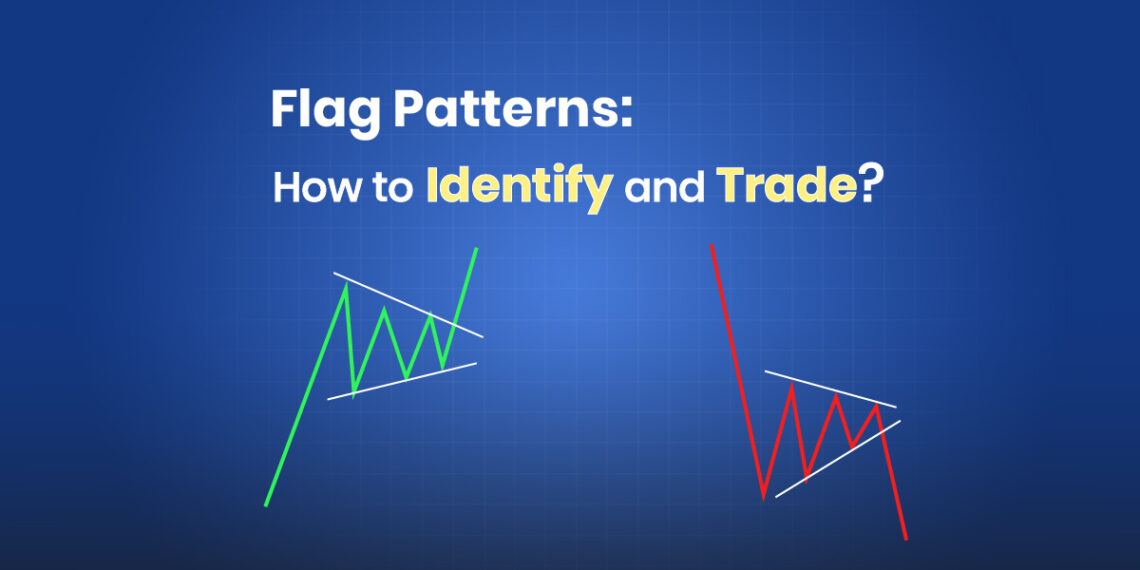
In a price chart, when a pictorial representation of a flag-like structure is formed on a particular time frame, is known as flag patterns. As with any normal flag, this chart pattern also consists of a pole and the actual flag. But how does it help you in generating trading signals? Let’s find out!
How to trade Flag patterns?
By definition, chart patterns are of two different types: reversal chart patterns and continuation chart patterns. Flag patterns are continuation chart patterns meaning it follows a similar trend of stock after forming the pattern. Flag patterns generally represent a phase of consolidation in an ongoing trend of a stock. A breakout or a breakdown from the consolidation phases generates a trading signal. However, a bullish or a bearish signal depends on the type of flag patterns formed.
Type of Flag Patterns
There are basically two different types of flag patterns based on the trend of a stock.
1. A bullish flag pattern is mostly likely to form in stocks which are in an up trend. A bullish flag pattern indicates a short price consolidation in an on going up trend. A breakout of the flag pattern suggests a continued bullish trend.
2. A bearish flag pattern is most likely to form in stocks which are in downtrend. A bearish flag pattern indicates a short price consolidation in an ongoing down trend. A breakdown of the flag pattern suggests a continued bearish trend.
Here is an illustration of the bullish flag pattern and bearish flag pattern:
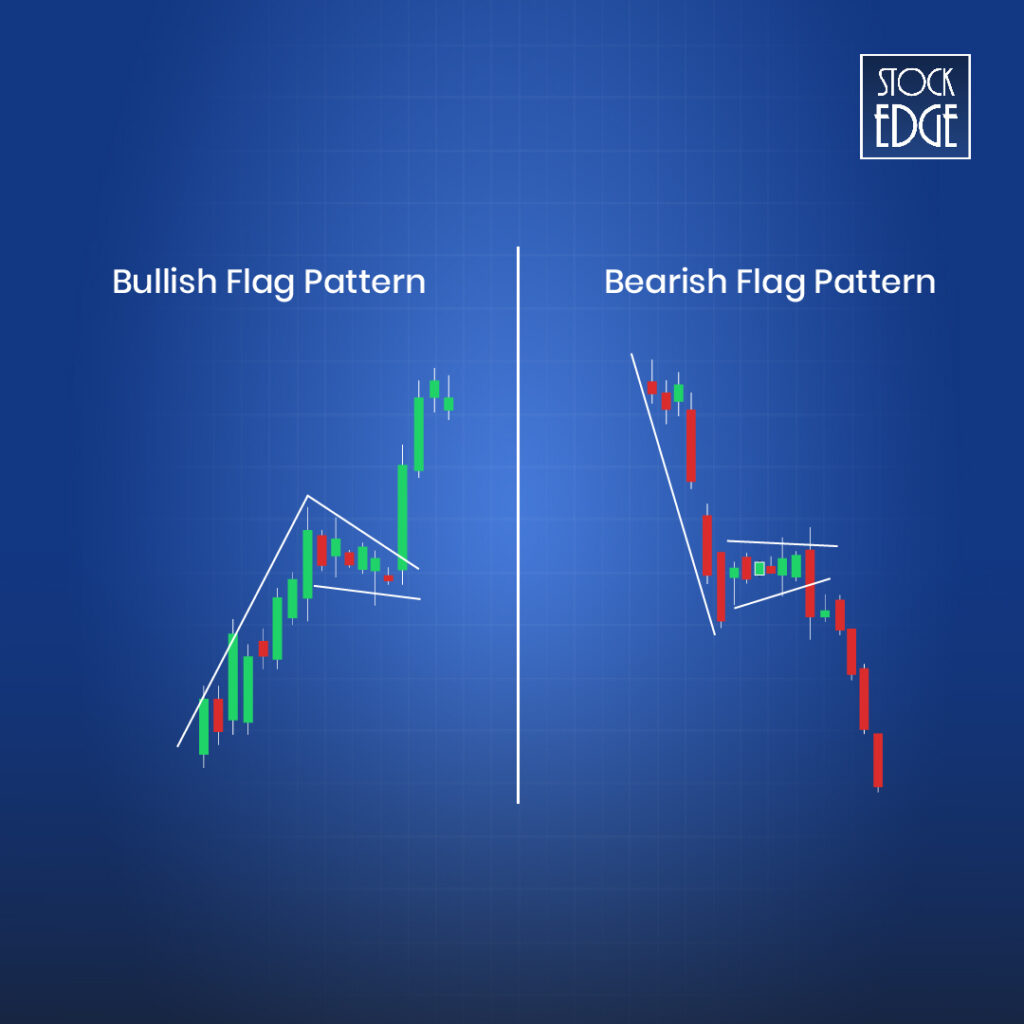
In the above infographic image, you can see a clear distinction between the two flag patterns. These flag patterns can be found in any time frame – minutes, hourly, daily, weekly and more. But before you trade a bullish flag pattern or a bearish flag pattern, it is important to identify such flag patterns.
How to identify Flag Patterns?
Flag patterns or chart patterns, in general, are very difficult to spot in price charts, especially if you are a beginner in your trading journey. There are 6000+ stocks that are traded in both stock exchanges: the NSE and the BSE. So, manually identifying flag patterns in stock out of so many can be a tedious task.
Thankfully, StockEdge has a simple solution to it. We have developed a method to spot chart patterns using artificial intelligence (AI). Our AI models identify chart patterns on the price chart so that you don’t miss a trading opportunity. Read more on Chart Patterns – Holy grail of Stock Market Analysis
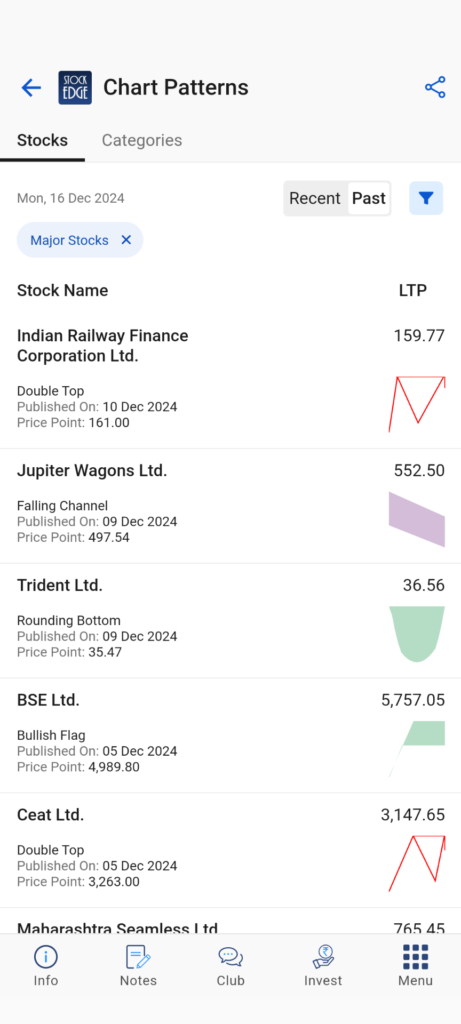
The chart pattern feature in StockEdge app, not only spot flag patterns but also identifies other chart patterns like triangles, head and shoulders, wedges, channels etc. Moreover, it shows both recent and past chart patterns formed in a stock.
Now that you know how to identify flag patterns, it is time to discover how to trade them. The next section of the blog explains trading the bullish flag patterns and bearish flag patterns one by one. So, without further ado, let’s get started.
What is Bullish Flag Pattern?
A bullish flag pattern as the name suggests indicates a buy signal in a stock when it is formed. It is a continuation chart pattern meaning after giving a breakout of a bullish flag pattern the stock is most likely to continue its ongoing trend which is an up trend for most bullish flag patterns.
A bullish flag pattern starts with a sharp rise in price of a stock which forms the pole of the flag, followed by a short price consolidation which forms the actual flag. A breakout of the flag pattern generates a buy signal.
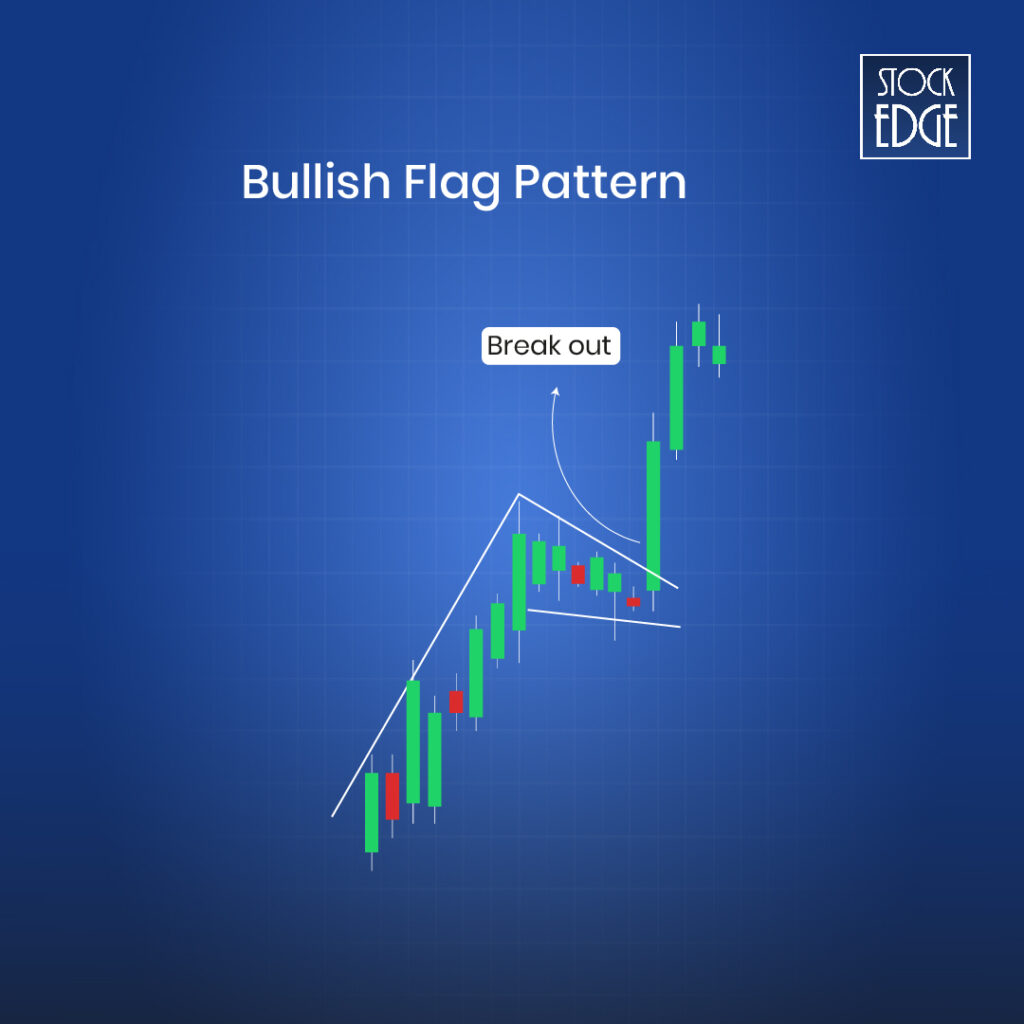
Interpretation of a Bullish Flag Pattern
- The initial steep, almost vertical price surge indicates the “pole.” This reflects a strong bullish momentum.
- After the pole, there is price consolidation. It is generally a rectangular pattern, sloping slightly downward or moving sideways. This occurs as traders take profits, creating a temporary pause in the upward trend.
- Once the consolidation ends, the price typically “breaks out” in the direction of the preceding trend (upwards), continuing the bullish momentum.
How to trade bullish flag pattern?
First of all you need to identify a bullish flag pattern on stock which can be done easily with the help of StockEdge.
- Go to https://web.stockedge.com/ or open the StockEdge App
- Click on the Analytics tab and select Chart Patterns
- You can now view the list of stocks where chart patterns are formed.
Once you spot a bullish flag pattern on the recent list, open up the price chart. You may enter a long trade once the stock gives a breakout above the flag. But what should be the target and stop loss? Let’s find out with an example.
Example of a Bullish Flag Pattern
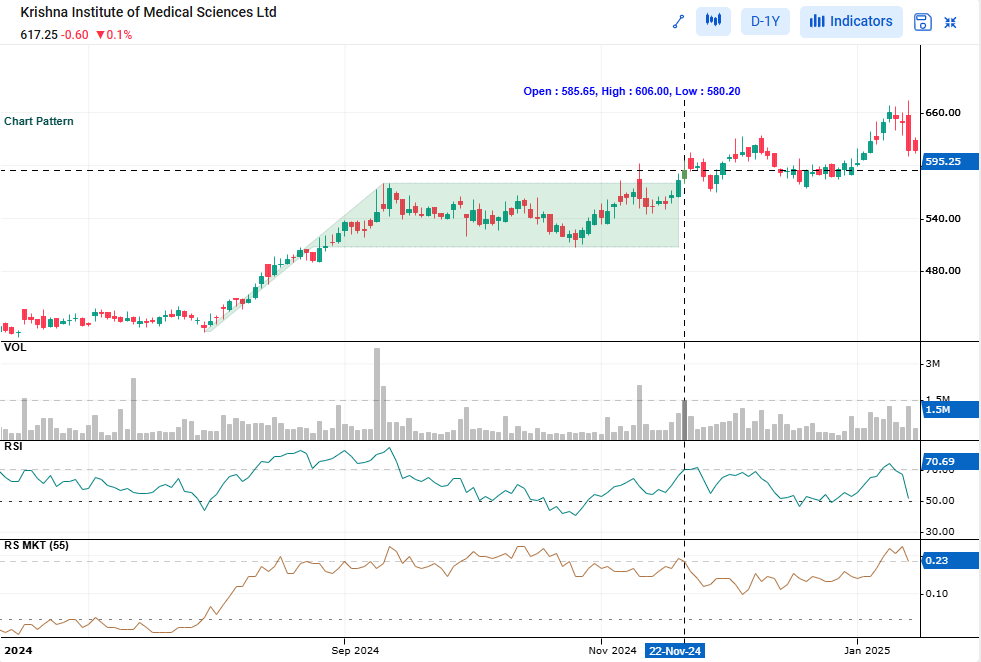
As per the StockEdge Chart Pattern, the stock Krishna Institute of Medical Sciences Ltd. gave a breakout of a bullish flag pattern on the daily chart on 21st November 2024.
You can see, the stock made a continuous rise which determined the pole of a flag. Next it consolidates for a while before giving a breakout forming flag pattern.
- Entry – Once stock gives breakout, you can enter a long position.
- Target – The length of the pole ideally becomes the target for the bullish flag pattern from the breakout level.
- Stop-Loss – The base or the swing low of the flag becomes the stop loss for the pattern.
What is Bearish Flag Pattern?
Think of it as an upside-down flag.
A bearish flag pattern as the name suggests indicates a sell signal in a stock when it is formed. It is a continuation chart pattern meaning after giving a breakdown of a bearish flag pattern the stock is most likely to continue its ongoing trend which is a downtrend for most bearish flag patterns.
A bearish flag pattern starts with a sharp decline in price of a stock which forms the pole of the flag, followed by a short price consolidation which forms the actual flag. A breakdown of the flag pattern generates a sell signal.
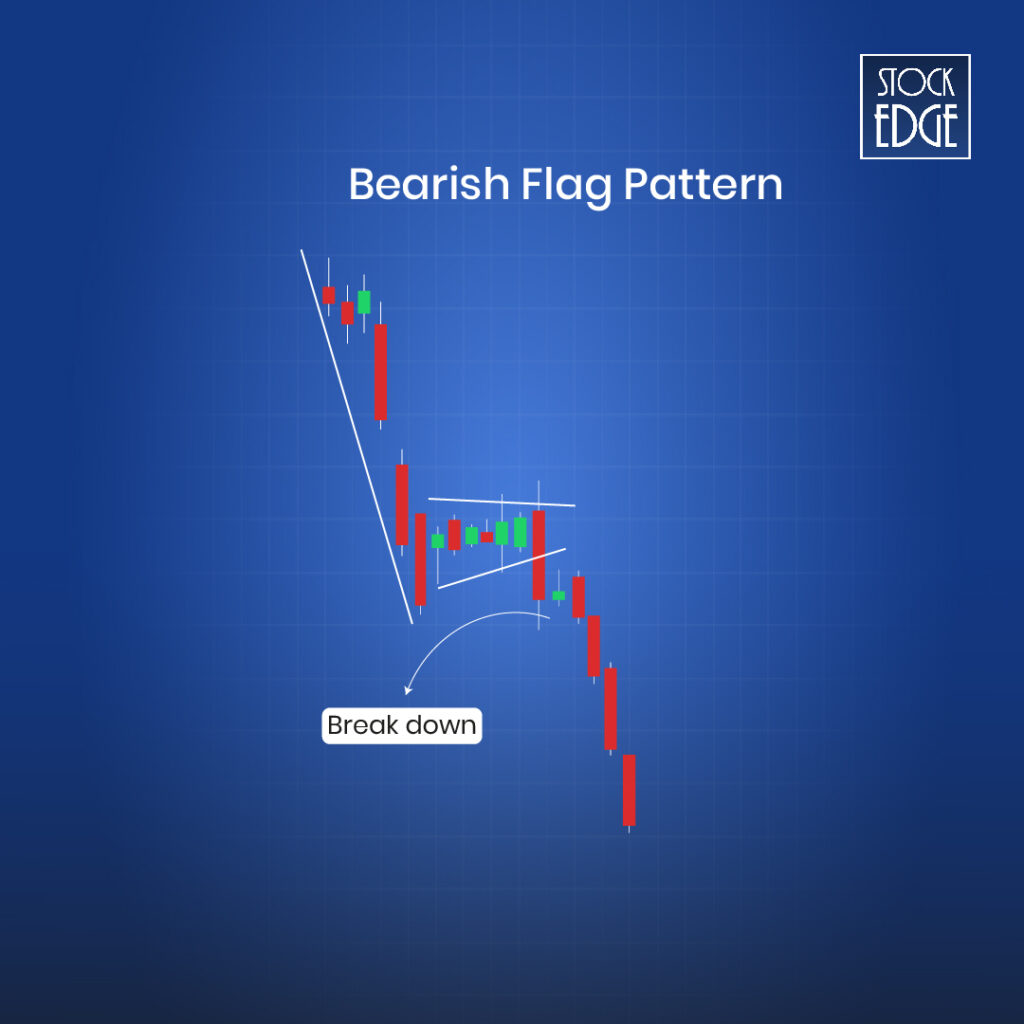
Interpretation of Bearish Flag Pattern
- A steep, almost vertical drop in price creates the “pole,” showcasing strong bearish momentum.
- Following the pole, the price consolidates in a rectangular shape that slopes slightly upward or moves sideways. This reflects a temporary pause as sellers and buyers reach a short-lived balance.
- The pattern completes when the price breaks below the consolidation zone, resuming the downward trend.
How to trade bearish flag pattern?
In a similar way, identify a bearish flag pattern on the stock using the StockEdge chart pattern. Once you spot a bearish flag pattern on the recent list, open up the price chart. You may enter a short trade once the stock gives a breakdown below the flag. But what should be the target and stop loss? Let’s find out with an example.
Example of a Bearish Flag Pattern
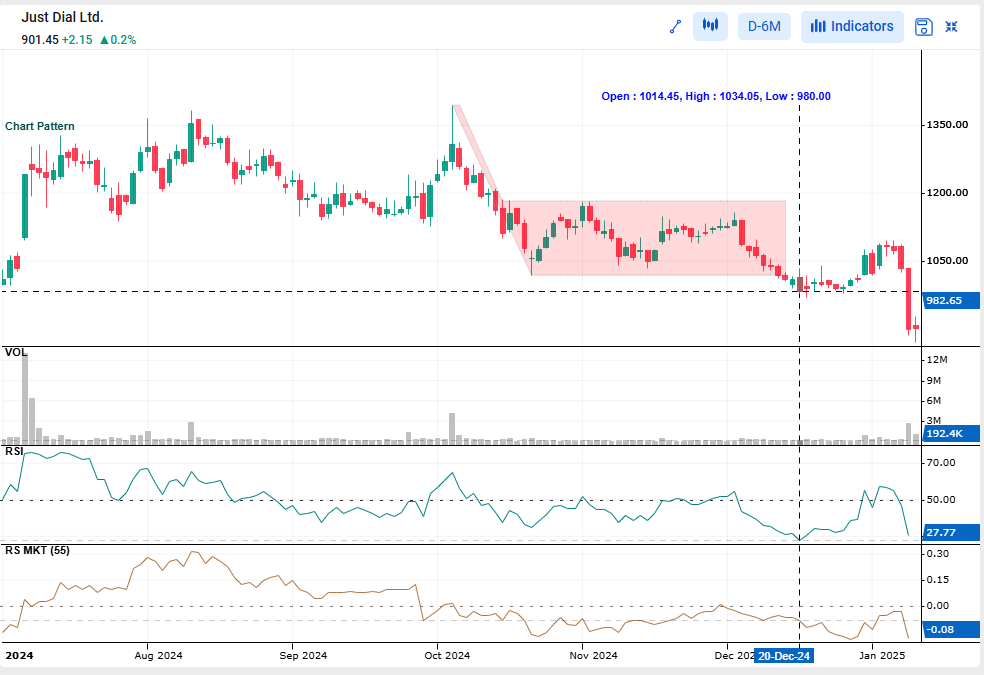
As per the StockEdge Chart Pattern, the stock Just Dial Ltd. gave a breakdown of a bearish flag pattern on the daily chart on 18th Dec 2024. You can see that the stock made a sharp decline, which determined the pole of a flag (upside down). Next, it consolidates for a while before giving a breakdown, forming a flag pattern.
- Entry – Once stock gives a breakdown, you can enter a short position.
- Target – The length of the pole ideally becomes the target for the bearish flag pattern from the breakdown level.
- Stop-Loss – The base or the swing high of the flag becomes the stop loss for the pattern.
The Bottom Line
Flag patterns are among the most reliable chart formations for identifying trend continuations in the stock market. Whether bullish or bearish, these patterns provide you with a structured way to capitalize on the momentum by entering trades with a clear understanding of potential breakout points, stop-loss levels, and profit targets. You can master the art of trading flag patterns by combining other technical indicators. This is an excellent way to make informed decisions and enhance your trading strategies. Remember, while flag patterns are powerful tools, no strategy is foolproof—always practice sound risk management to navigate market uncertainties effectively.
Happy trading!


