Table of Contents
EBITDA growth is an extensively used parameter when it comes to studying the fundamentals of a company. It is a financial ratio used to measure a company’s ability to optimize the expense to sales ratio. A financial ratio is a representation of selected numerical values from a company’s financial statements. It helps in deciding the growth of a company. There are a lot of ratios such as PE Ratio, Net profit margin, interest coverage ratio, etc.
You can also watch the below video to know Everything you want to know about EBITDA Growth:
What is EBITDA Growth?
Ebitda stands for Earnings before interest, tax, depreciation, and amortisation. It is a measure of a company’s operating performance. It eliminates the effects of financing and accounting decisions. The higher the EBITDA growth the better is the company’s growth potential. It is derived by subtracting Expenses incurred from Sales and adding back Interest cost + Tax + Depreciation and amortisation.

EBITDA Growth Formula:
The formula is (Current period Ebitda- Prior period Ebitda)/Prior period Ebitda.
For eg: Suppose in 2016-17 the company sales is 50 crores and expenses excluding interest tax and depreciation or amortisation is 45 crores then EBITDA is 5 crores and similarly, in 2017-18 the company sales is 57 crores and expenses excluding interest tax and depreciation or amortisation are 50 crores then EBITDA is 7 crores
Ebitda growth (%) = (7-5)/5= 40%.
See also: EBITDA Margin (%)
Impact of Ebitda growth
This is a better measure compared to net sales growth percentage. In the net sales growth percentage loss making transactions could also be accounted for like say an e-commerce company. Flipkart could be selling its goods below the cost price or at break even in order to boost sales. Hence Ebit is a better margin. Growth in EBITDA signifies an improvement in the efficiency of a company. If there is growth in EBITDA, it will enhance the EPS of a company thereby shooting the market price of a stock upwards.
Exceptions
However historical data may not always be a foolproof way towards future perception as the industrial and economic conditions may wary every year especially for the cyclical stocks.
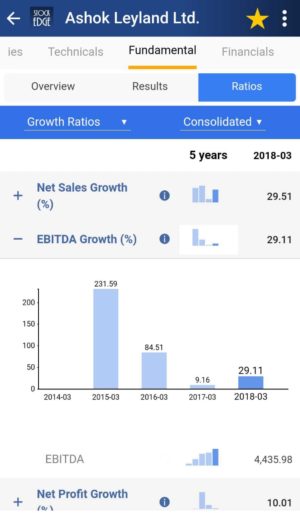
Nowadays we don’t have to calculate EBITDA growth (%) on our own. StockEdge gives us EBITDA growth (%) of the last five years of any company listed in the stock exchange. We can look and compare EBITDA growth (%) of any company and filter out stocks accordingly.
Suppose we want to look at the EBITDA growth (%) of Ashok Leyland of the last 5 years. In the Fundamental tab of Ashok Leyland, click on the fundamentals tab, we will get the Ratios tab. Then in the Ratios tab click on Growth Ratios, EBITDA growth (%) will come of Ashok Leyland in a flicker of a second making our work simpler.
Frequently Asked Questions
What is a good EBITDA growth rate?
A good EBITDA growth rate varies by industry, but a 60% growth rate in most industries would be a good sign.
Why EBITDA is so important?
EBITDA helps to analyze and compare profitability between companies and industries, it eliminates the effects of financing, government or accounting decisions. This provides a clearer indication of the earnings.
What is a good EBITDA score?
A good EBITDA score is a higher number in comparison with its peers. There is no single figure that points to an optimal EBITDA score.
Bottomline
Ebitda growth percentage is an important barometer to measure the growth and future prospects of a company. With the help, these ready-made parameters you can with the click of a button filter out good companies for free under our stocks tab. We also have Ebidta growth scans under our premium plan. These scans are part of the premium offerings of StockEdge app.
Click here to know: StockEdge Premium
Also read: Factors that affect EBITDA and EBIT.


