Table of Contents
Key Takeaways
- Legacy Brand with Global Reach: Founded in 1892, Britannia Industries is one of India’s oldest food companies, renowned for its biscuit brands like Good Day, Marie Gold, and Tiger. The company operates 23 factories and exports products to over 79 countries.
- Diversified Product Portfolio: While biscuits account for 77% of revenue, Britannia has expanded into bread, dairy, cakes, snacks, and milkshakes. This diversification aims to reduce dependency on a single product category.
- Strong Financial Performance: In Q4 FY25, the company reported a net profit of ₹559.95 crore, marking a 4% year-on-year growth. Total revenue increased by 8.9% to ₹4,432.19 crore. Promoters maintain a steady stake of 50.55%, reflecting confidence in the company’s long-term prospects.
- Strategic Growth Plans: Britannia aims to increase the contribution of its non-biscuit portfolio to 35% of total revenue over the next five years, focusing on innovation, cost leadership, and sustainability.
- Attractive Dividend: The company has recommended a final dividend of ₹75 per equity share for the financial year ending March 31, 2025, demonstrating its commitment to shareholder returns.
Britannia Industries Ltd. is an Indian Fast-Moving Consumer Goods (FMCG) company, previously recognized as “Britannia Biscuit Company Limited.” It originated during the pre-independence period in Calcutta, founded by a British entrepreneur in the year 1892. The company is currently owned by the Wadia group, headed by Nusli Wadia, an Indian billionaire businessman.
In the course of World War II, the British Indian government necessitated a consistent provision of biscuits to cater to the requirements of British soldiers. Hence, the company was established. As of today, Britannia Industries manufactures and sells biscuits all over the world. Being a public limited company, Britannia Industries shares have been listed on the National Stock Exchange (NSE) since 1998. Additionally, it is a part of the market benchmark index Nifty 50.
In today’s blog, let’s find out whether to invest in a century-old biscuit company. Britannia Industries shares have given more than a 1000% return in the last 10 years. Is it still worth investing in Britannia shares? Here is a complete fundamental analysis of Britannia Industries’ share.
Company Overview
Britannia Industries Ltd stands as one of India’s oldest food product companies and holds a significant position in the country’s biscuit industry. While the majority of its revenue is generated from the biscuits segment, the company has expanded its presence into various other sectors, such as bread, dairy products, cakes, snacks, milkshakes, croissants, wafers, and rusks. Some of its prominent brands include Good Day, Marie Gold, Tiger, Nutri Choice, Milk Bikis, and others. Operating with a total of 23 factories (19 national and 4 international), Britannia also exports its products to over 79 countries spanning the Middle East, North America, Europe, Africa, and Southeast Asia.
Here is the revenue mix of the company as of FY 23:
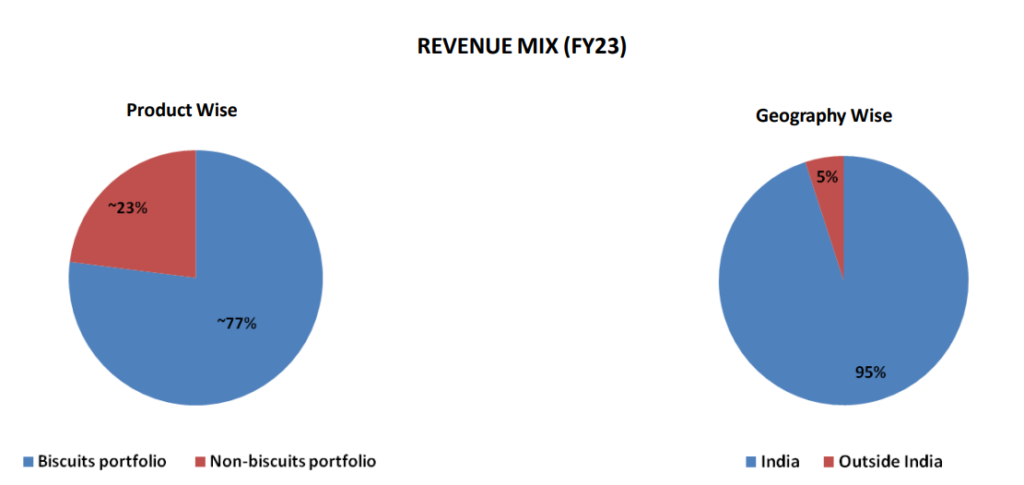
As you see, 77% of the revenue comes from the biscuits segment, while the rest comes from bread, dairy products, cakes, etc. Also, geographically, 95% of revenue comes from India and the remaining 5% is from other countries globally.
Sectoral Outlook – FMCG Sector
The overall size of the Food & Beverages market in India is estimated at USD 800 billion. Within this, the packaged food market constitutes USD 100 billion, with the branded packaged market accounting for USD 40 billion. This indicates significant potential for expansion. Presently, India lags behind China in the packaged food industry by 4.2 times and other Southeast Asian nations, such as the Philippines, by 3.3 times, highlighting substantial room for growth in this sector.
The shift from an unorganized to an organized segment within the industry is expected to persist in India in the upcoming years. Changing consumer preferences and a growing inclination towards adopting branded products in small towns and villages contribute to the expansion of Fast-Moving Consumer Goods (FMCG) companies.
Financial Highlights
Analyzing financial statements such as income statements, balance sheets, and cash flow statements helps investors assess the company’s ability to generate returns, manage debt, and sustain growth, enabling informed and prudent investment choices.
Income statement of Britannia Industries Ltd.
The income statement, commonly known as the profit and loss statement, gives you an understanding of its financial performance, such as its sales growth, profitability, etc.
At StockEdge, we have organized the income statement in a way that will help you analyze it with ease rather than going through the conventional way of downloading the documents from the stock exchanges, which could be time-consuming and tiresome to many.
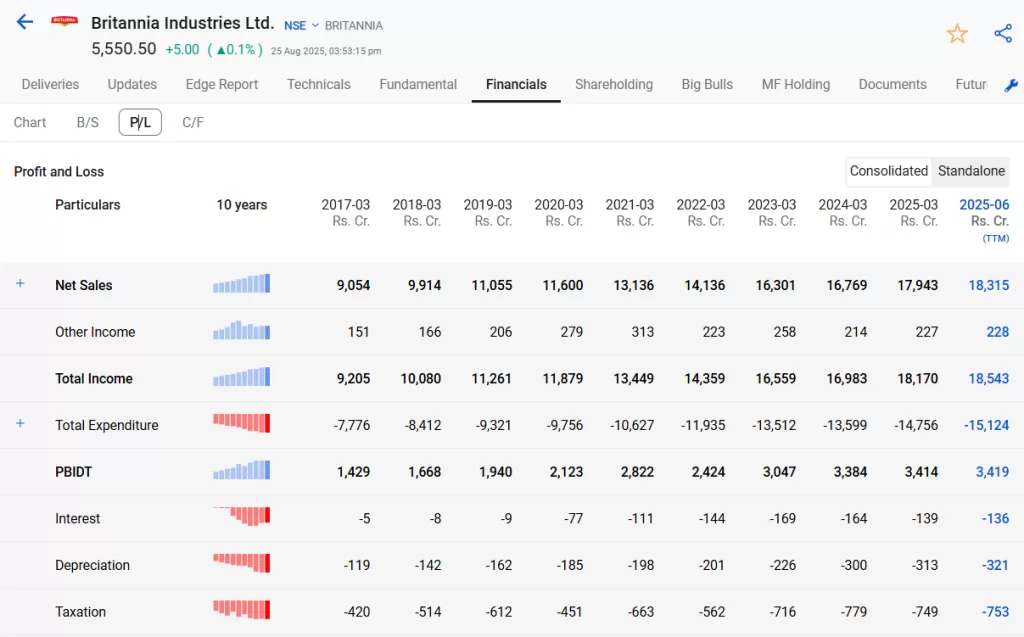
In the above image, you can see the annual income statement of Britannia Industries. Every detail is in front of your eyes, starting from the top-line sales figures to the bottom-line Net profit of the company.
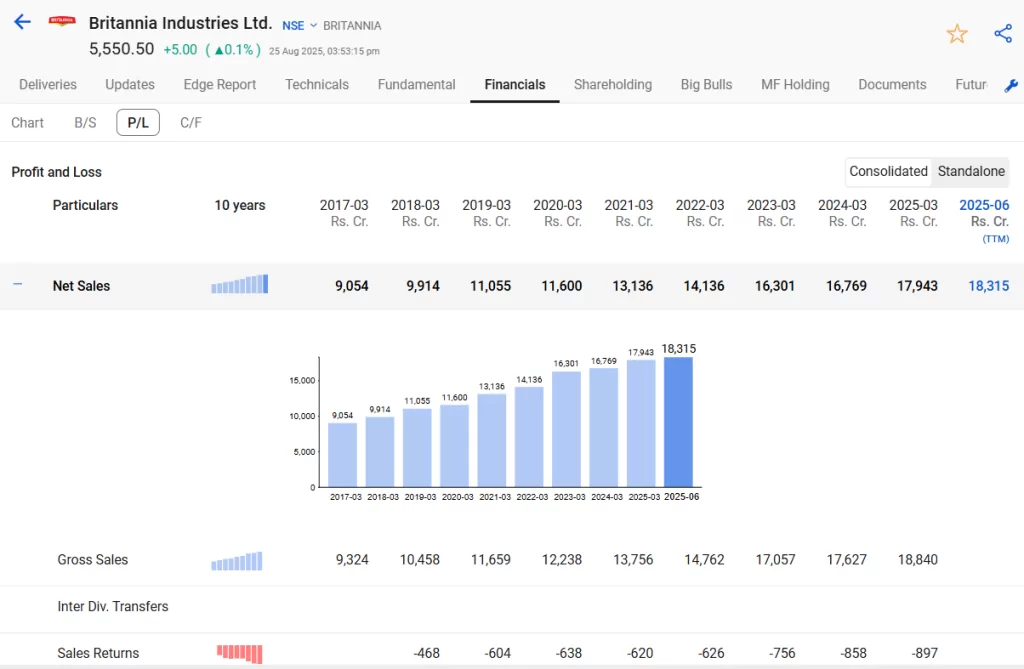
Sales Growth
The sales have improved compared to the last years and recorded Rs. 18315 Crores for the FY25-26.
Balance Sheet of Britannia Industries Ltd.
The balance sheet follows the accounting equation: Assets = Liabilities + Equity. It provides a company’s financial position, stability, and overall health.
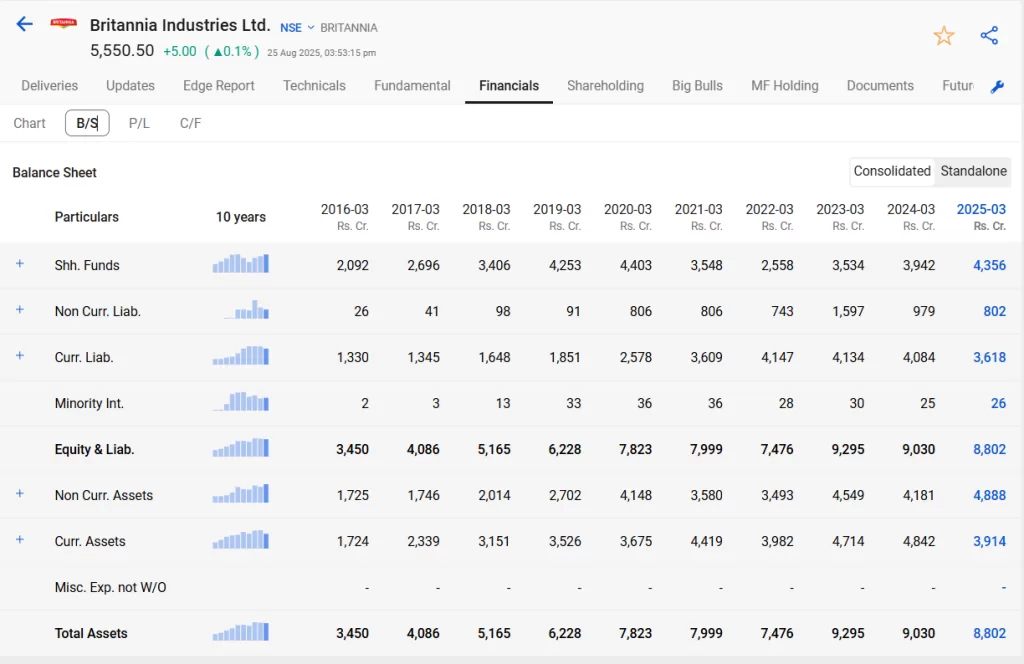
In the above image, you can see the balance sheet of Britannia Industries Ltd. It provides an overview of the financial position as on date. What are the assets and liabilities of the company? Liabilities of a company can be both short term and long term.
Britannia’s balance sheet shows steady growth in shareholder funds, rising from ₹2,092 Cr in FY16 to ₹4,356 Cr in FY25, reflecting strong wealth creation. Current liabilities remain high at ₹3,618 Cr in FY25, indicating reliance on short-term borrowings/payables, though manageable given strong current assets of ₹3,914 Cr. Non-current liabilities peaked in FY23 (₹1,597 Cr) but have since moderated to ₹802 Cr in FY25, lowering long-term debt pressure.
Assets have grown consistently from ₹3,450 Cr in FY16 to ₹8,802 Cr in FY25, with a healthy mix of non-current and current assets, highlighting expansion and liquidity. Overall, Britannia maintains a robust balance sheet with controlled leverage, solid asset growth, and improving equity base, though high current liabilities remain a key monitoring point.
Cash Flow Statement of Britannia Industries Ltd.
A cash flow statement provides a summary of how a company generates and uses cash over a specific period of time. It has three different sections:
- Operating cash flow statement
- Financing cash flow statement
- Investing cash flow statement
Out of these the most important one being the cash flow from operations as it provides you with an understanding of how the company generated cash from its core business operations. A positive cash flow from operation signifies that the company has generated higher cash revenue than its expenditure.
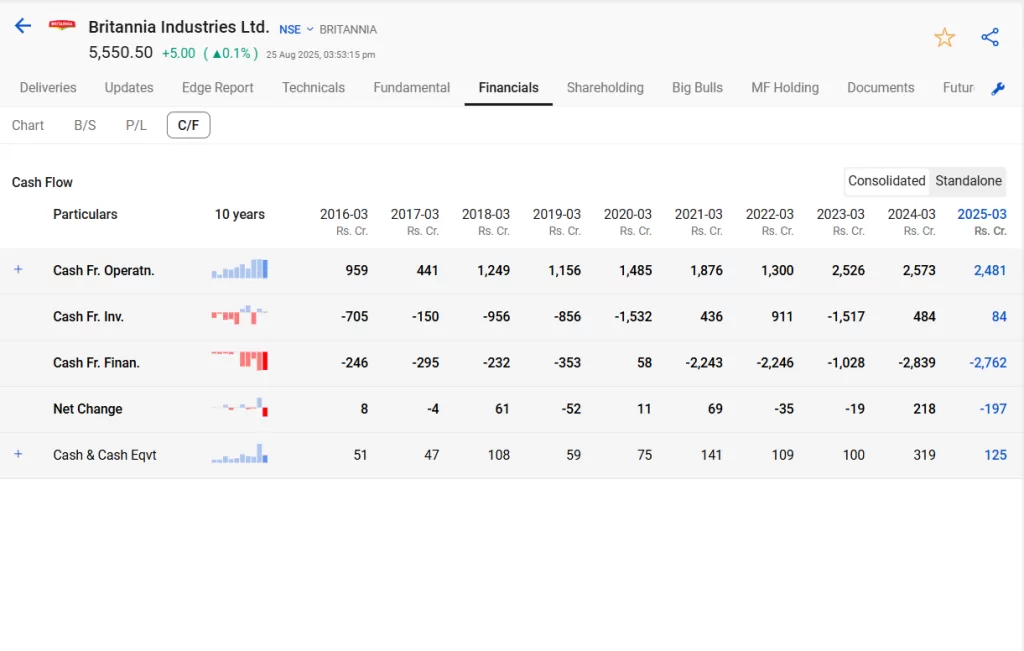
The cash flow analysis of Britannia Industries Ltd. shows strong and consistent growth in cash from operations, rising from ₹959 Cr in FY16 to over ₹2,400 Cr in FY25, reflecting healthy core business performance. However, the company’s financing cash flow is largely negative in most years, especially FY21, FY22, FY24, and FY25, indicating high dividend payouts, debt repayment, or share buybacks. Investment cash flow fluctuates, with significant outflows in expansion years (e.g., FY20 & FY23) and some inflows in FY21 & FY24.
Despite strong operating cash, the net change in cash remains inconsistent, with FY25 showing a decline (–₹197 Cr) due to heavy financing outflows. Overall, Britannia generates robust cash from business operations but faces volatility in free cash due to aggressive capital allocation and financing activities.
Ratio Analysis of Britannia Industries Share
Ratio analysis of a company involves evaluating a company’s financial performance by examining certain ratios which are derived from its financial statements. It makes easy comparing the financial performance to its industry benchmarks or competitors.
Ratio has different classifications like profitability ratios, solvency ratios, return ratios and more as you can see in the image below, you can analyze all such ratios directly from StockEdge.
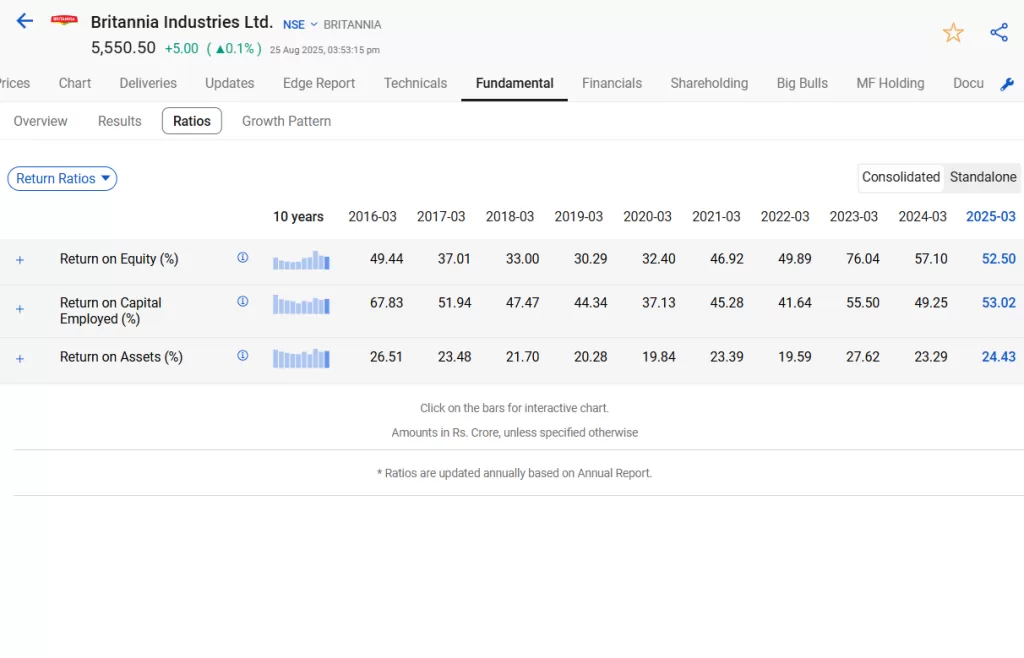
The company has consistently delivered strong Return on Equity (ROE), averaging above 40%, with peaks like 76% in FY23 and currently at 52.5% in FY25, reflecting efficient use of shareholders’ funds. Return on Capital Employed (ROCE) also remains robust, consistently above 40% (FY25: 53.02%), indicating strong profitability relative to total capital.
Return on Assets (ROA), though lower compared to ROE/ROCE, has been steady in the 20–27% range and stands at 24.43% in FY25, showcasing effective utilization of assets. Overall, Britannia demonstrates excellent capital efficiency and profitability, making it a fundamentally strong company.
Management Quality & Shareholding Pattern
The leadership is directing efforts towards implementing localized strategies, consistently innovating products through renovation, introducing new items, and revamping existing ones. Additionally, there is a focus on expanding into related product categories alongside a concerted effort to enhance direct distribution channels and strengthen the company’s presence in rural areas. Management expects the rural segment to improve to 35% of total revenue in the next few months.
Coming to the shareholding pattern of Britannia Industries share, you can check it from the StockEdge App itself.
The shareholding pattern of Britannia Industries Ltd. (June 2025) shows strong promoter stability with holdings unchanged at 50.55% across the last nine quarters. Public shareholding is steady at 49.45%. A key trend is the decline in FII/FPI stake from 21.29% (Jun 2023) to 15.58% (Jun 2025), indicating reduced foreign interest. In contrast, DII holdings have risen significantly from 12.46% to 18.66%, showing strong domestic institutional confidence.
Non-institutional holdings remain stable around 15–16%, and promoter pledging is zero, highlighting balance sheet strength. The total number of shareholders has grown from 2.60 lakh to 2.73 lakh, reflecting increasing retail participation. Overall, while FIIs have trimmed exposure, DIIs and retail investors are strengthening the shareholder base, signaling confidence in the company’s long-term growth.
Future Outlook of Britannia Industries Share
The company maintains its commitment to four key strategic pillars: distribution and marketing, cost leadership, innovation, and sustainability. The overarching goal is to achieve well-rounded growth encompassing margin, revenue, volume, and market share. Over the next five years, the company anticipates increasing the contribution of its non-biscuit portfolio to approximately 35% of total revenue, up from the current 23%. Furthermore, there is an ambition to be the top gainers by scaling the dairy segment to ₹2,000 crore within the same timeframe.
Case Study on Britannia Industries Share
We have a case study report prepared by our team of analysts. This fundamental report on Britannia Industries shares provides you with a detailed analysis of the company as well as how it stands among its competitors.
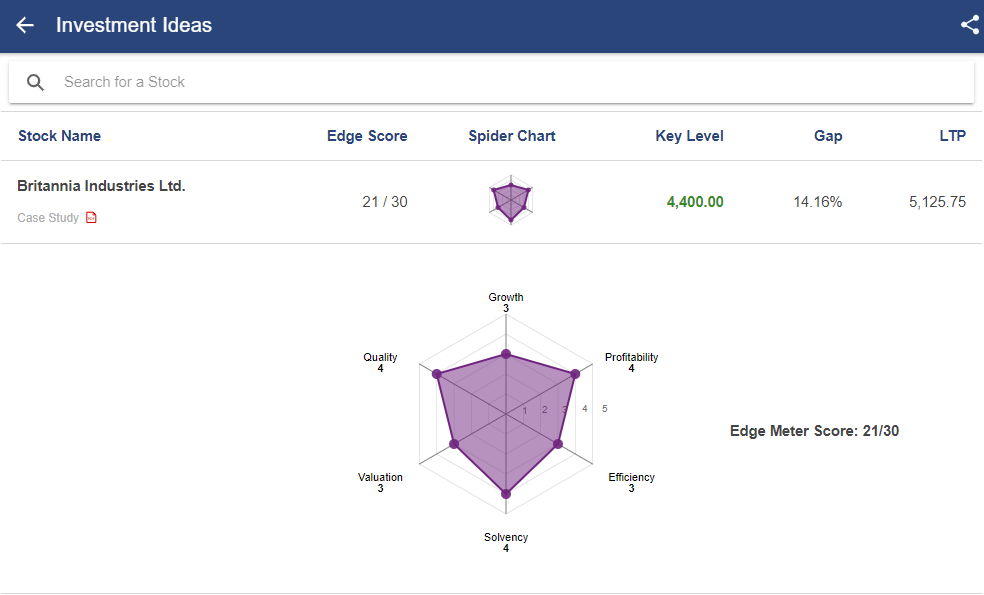
As you can see, Britannia Industries Share has rating based on 6 parameters:
- Growth
- Quality
- Profitability
- Efficiency
- Solvency
- Valuation
Based on the above parameters, Britannia Industries Share scored 21/30. Read the case study report on Britannia Industries Share.
Conclusion
In conclusion, Britannia Industries emerges as a compelling long-term investment opportunity. With a solid foundation anchored in strategic pillars such as distribution, cost leadership, innovation, and sustainability, the company demonstrates a robust commitment to balanced growth. The resilience of its promoter shareholding, coupled with evolving investor interest, reflects confidence in the company’s trajectory. Britannia’s ambitious targets, including expanding its non-biscuit portfolio and scaling its dairy segment, further position it as a forward-looking player in the market. As it continues to navigate dynamic market conditions, Britannia Industries stands out as a promising choice for investors seeking enduring value and growth in their portfolios.
Apart from Nestle India stock, there are other stocks which are part of the Nifty 50 index. Read this blog All About NIFTY50, Components of NIFTY50, and How to Invest in it.
Happy Investing!!


