StockEdge.com
  • Products
    • StockEdge Premium
    • StockEdge Pro
    • StockEdge Club
  • Stories
StockEdge Blog
  • Trending Stocks
  • Insights
  • Technical Analysis
  • Fundamental Analysis
  • StockEdge Tutorials
  • Mutual Fund
No Result
View All Result
  • Trending Stocks
  • Insights
  • Technical Analysis
  • Fundamental Analysis
  • StockEdge Tutorials
  • Mutual Fund
No Result
View All Result
StockEdge
Home Tutorials Technical Tutorials
A logo with the text

2 year and 5 year Price Breakout Scan

StockEdge by StockEdge
May 24, 2024
Reading Time: 4 mins read
11.6k
VIEWS
Share on FacebookShare on XShare On WhatsApp

Table of Contents

  • What is a Breakout?
  • 2 Year Breakout Scans
    • Close Crossing 2 Year High
    • Close Crossing 2 Year Low
    • Close Within 2 Year High Zone
    • Close Entering 2 Year High Zone
    • Close Within 2 Year Low Zone
    • Close Entering 2 Year Low Zone
  • 5 Year Breakout Scans
    • Close Crossing 5 Year High
    • Close Crossing 5 Year Low
    • Close Within 5 Year High Zone
    • Close Entering 5 Year High Zone
    • Close Within 5 Year Low Zone
    • Close Entering 5 Year Low Zone

What is a Breakout?

A price movement through an identified level of support or resistance, which is usually followed by heavy volume and increased volatility, is a ‘breakout’. Traders will buy the stocks when the price breaks above a level of resistance and sell when it breaks below support.

2 Year Breakout Scans

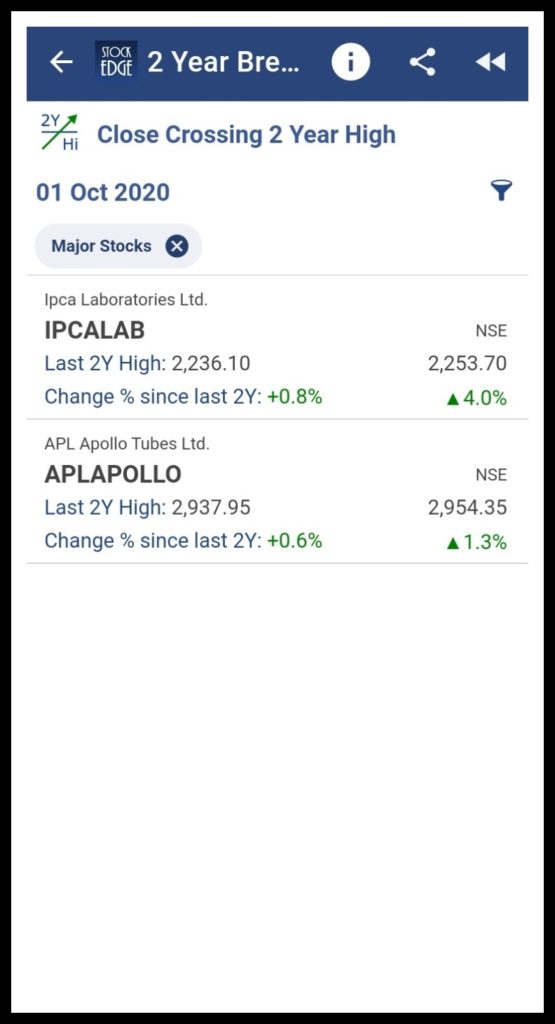
Close Crossing 2 Year High

Stocks whose closing price have crossed the last 2 year high of itself are displayed in this scan. This signifies that it is a bullish indicator as it indicates the stock is moving upward and has crossed its 2 year’s high.
Picsart 01 27 04. 54. 48

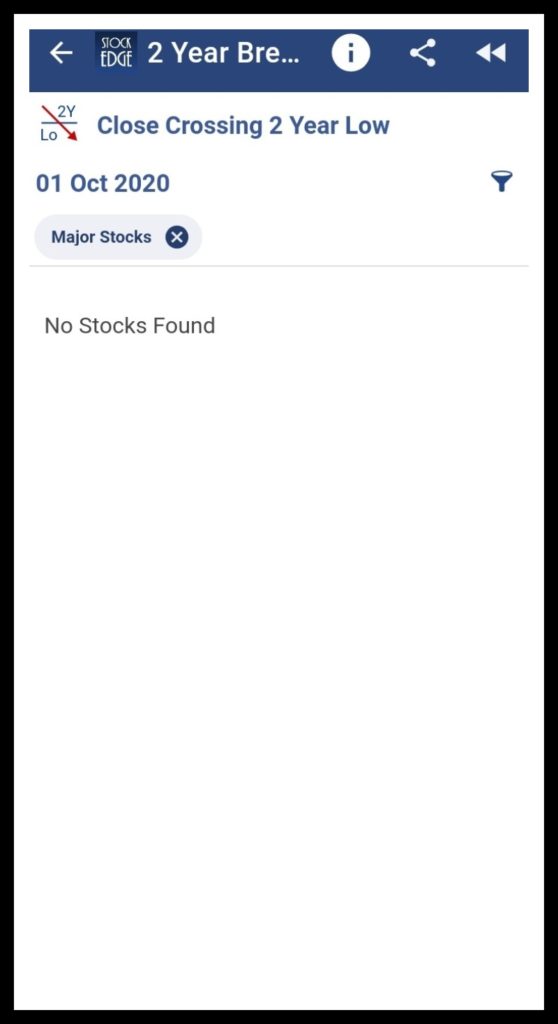
Close Crossing 2 Year Low

Stocks whose closing price have crossed the last 2 year low of itself are displayed in this scan. This signifies that it is a bearish indicator as it indicates the stock is moving downward and has crossed its 2 year’s low. Since no major stocks is fulfilling the criterion for the scan, its been displayed as “No Stocks Found”.
Picsart 01 27 04. 54. 14

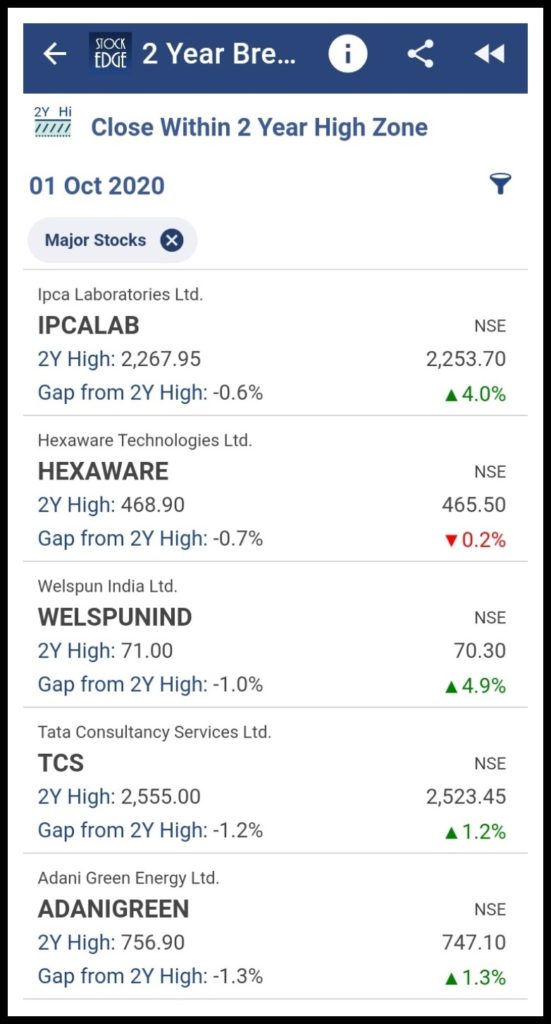
Close Within 2 Year High Zone

Stocks whose closing price is in the range 2 year high to 15% level below are displayed in this scan. This scan helps in identifying stocks which have strength and can show momentum.
Picsart 01 27 04. 55. 53

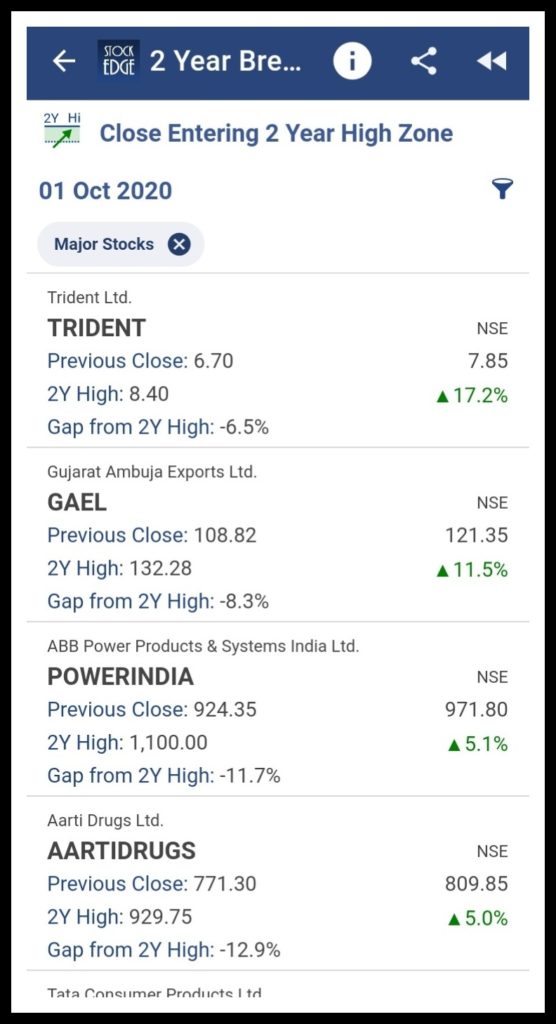
Close Entering 2 Year High Zone

Stocks whose closing price is in the range 2 year high to 15% level below are displayed in this scan. This scan also displays the gap from 2 Year High in percentage terms. This scan is a bullish indicator and shows stocks which have newly entered in this zone.
Picsart 01 27 04. 55. 23

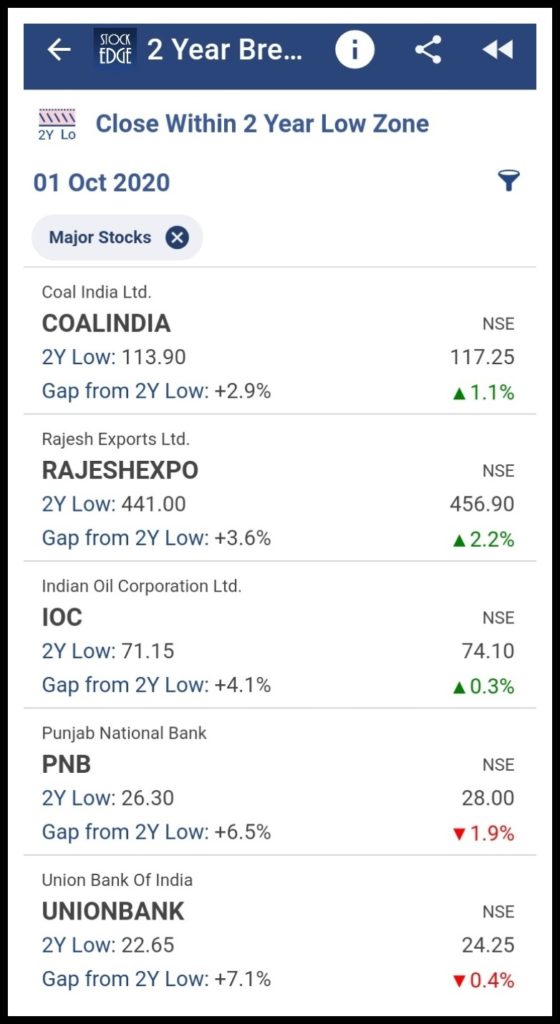
Close Within 2 Year Low Zone

Stocks whose closing price is in the range 2 year low to 15% level above are displayed in this scan. This scan also displays the gap from 2 Year Low in percentage terms.
Picsart 01 27 04. 56. 22

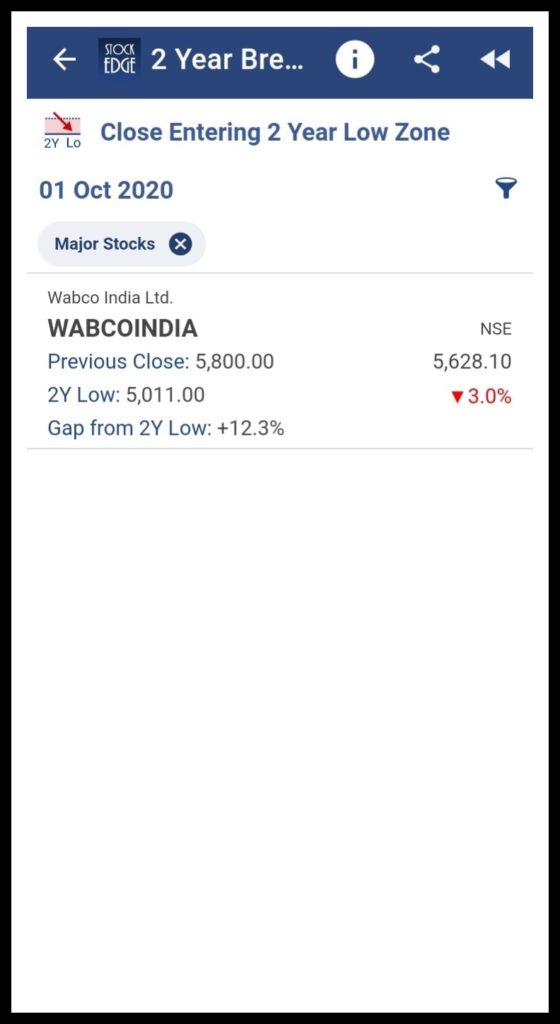
Close Entering 2 Year Low Zone

Stocks whose closing price is in the range 2 year low to 15% level above are displayed in this scan. This scan also displays the gap from 2 Year low in percentage terms. This scan is a bearish indicator and shows stocks which have newly entered in this zone.
Picsart 01 27 04. 58. 04 1

5 Year Breakout Scans

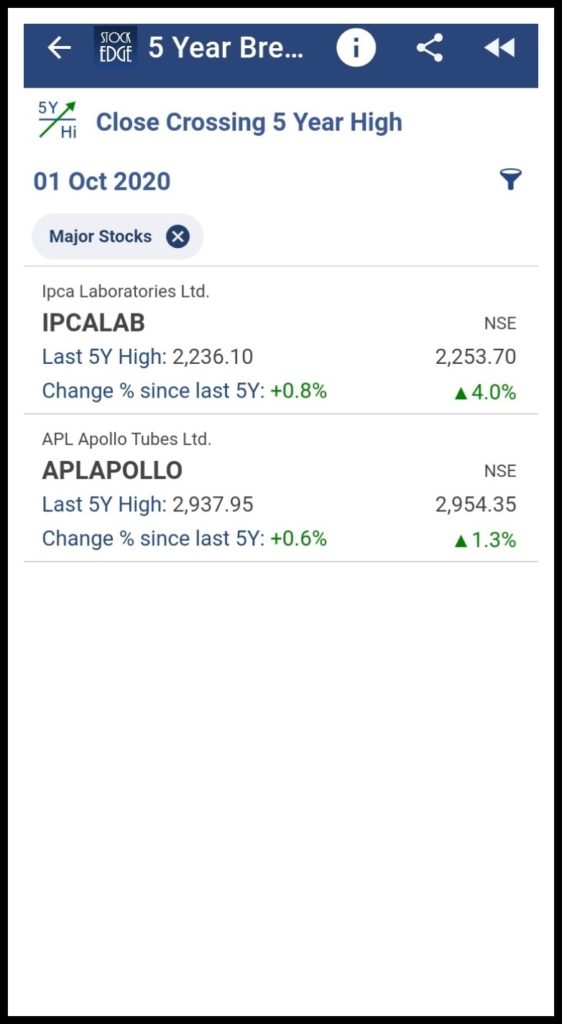
Close Crossing 5 Year High

Stocks whose closing price have crossed the last 5 year high of itself are displayed in this scan. This signifies that it is a bullish indicator as it indicates the stock is moving upward and has crossed its 5 year’s high.
Picsart 01 27 04. 56. 51

Close Crossing 5 Year Low

Stocks whose closing price have crossed the last 5 year low of itself are displayed in this scan. This signifies that it is a bearish indicator as it indicates the stock is moving downward and has crossed its 5 year’s low. Since no major stocks is fulfilling the criterion for the scan, its been displayed as “No Stocks Found”.
See also: Narrow Range Scans (NR)

Close Within 5 Year High Zone

Stocks whose closing price is in the range 5 year high to 15% level below are displayed in this scan. This scan also displays the gap from 5 Year High in percentage terms.
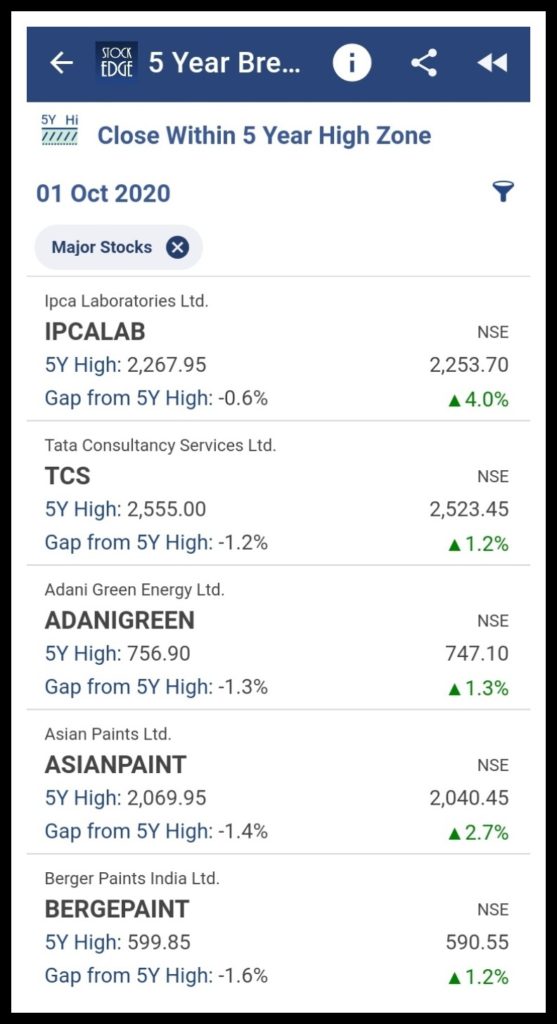
Picsart 01 27 04. 58. 46 1

Close Entering 5 Year High Zone

Stocks whose closing price is in the range 5 year high to 15% level below are displayed in this scan. This scan also displays the gap from 5 Year High in percentage terms. This scan is a bullish indicator and shows stocks which have newly entered in this zone.
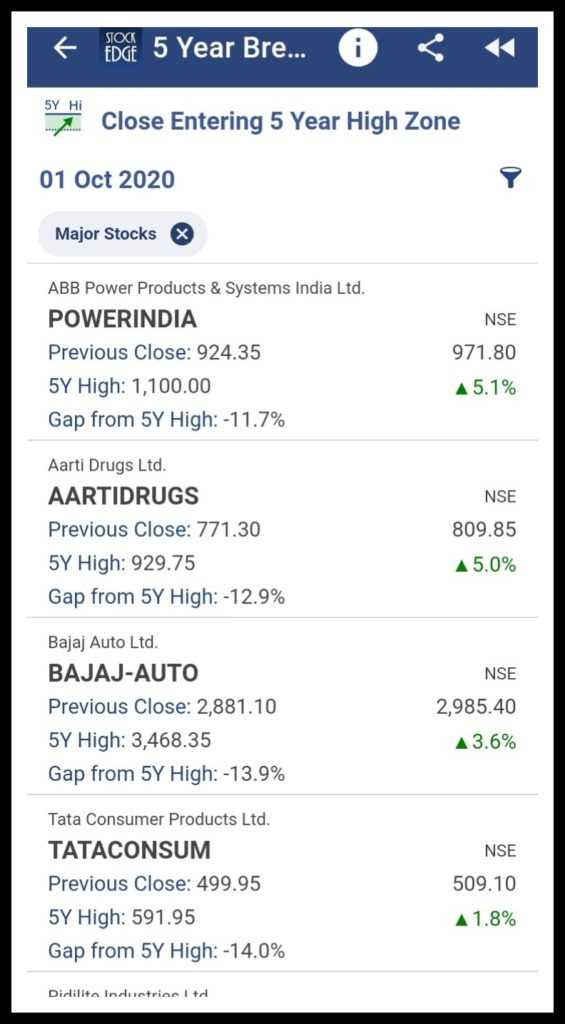
Picsart 01 27 04. 59. 49

Close Within 5 Year Low Zone

Stocks whose closing price is in the range 5 year low to 15% level above are displayed in this scan. This scan also displays the gap from 5 Year Low in percentage terms.
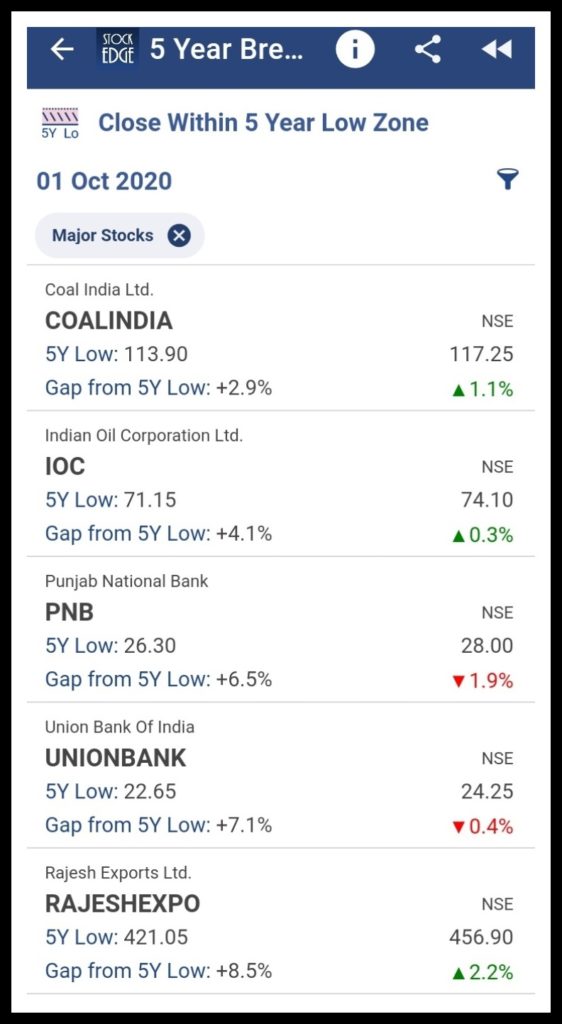
Picsart 01 27 04. 59. 20

Close Entering 5 Year Low Zone

Stocks whose closing price is in the range 5 year low to 15% level above are displayed in this scan. This scan also displays the gap from 5 Year low in percentage terms.

This scan is a bearish indicator and shows stocks which have newly entered in this zone. Since no major stocks is fulfilling the criterion for the scan, its been displayed as “No Stocks Found”.

Above are examples of the 2Y and 5Y breakout scans which can be used for buy and sell signals and also give us a list of the stock which fulfills the criteria of the scans for that particular day.

You can filter out the stocks and can trade accordingly using these scans.
2 Year and 5 Year breakout scans are one of the few premium tools offered by StockEdge App which you can download from the Play Store.
To check out our Premium plans from StockEdge.com.

Breakout
Tags: Stockedge apptechnical analysisTechnical scans
ShareTweetSend
Open A Zero Brokerage Account In Kotak Open A Zero Brokerage Account In Kotak Open A Zero Brokerage Account In Kotak
Previous Post

How to use Sharpe Ratio to analyze mutual funds?

Next Post

Treynor Ratio: Evaluating Mutual Funds

StockEdge

StockEdge

StockEdge is a self-help Equity and Mutual Fund research tool. It empowers retail investors to identify investment opportunity with all the necessary data and analytics.

Next Post
How to use jensen’s alpha to evaluate mutual funds?

Treynor Ratio: Evaluating Mutual Funds

A graphic representation of the latest version of the stockedge app in a blue background.

Update to Latest Version of StockEdge 5.3

A line graph showing open interest data for four groups: pro, client, fii, and dii in a blue background.

Understanding Participant Wise Open Interest

Disclaimer

StockEdge (Kredent InfoEdge Pvt. Ltd.) is a SEBI-registered Research Analyst (RA) entity (SEBI Registration No: INH300007493). The information provided in this article is for educational and informational purposes only and should not be considered as an offer to buy or sell any securities or investment products.

The stocks, securities, and investment instruments mentioned herein are not recommendations under SEBI (Research Analysts) Regulations, 2014. Readers are advised to conduct their own due diligence and seek independent financial advice before making any investment decisions.

Investments in securities markets are subject to market risks. Please read all related documents carefully before investing. Investing in Equity Shares,
Derivatives, Mutual Funds, or other instruments carry inherent risks, including potential loss of capital. StockEdge (Kredent InfoEdge Pvt. Ltd.) does not provide any guarantee or assurance of returns on any investments. Past performance is not indicative of future performance.

Contact Us
  • Timing (Mon-Sat): 10 am to 7 pm
  • Sales: +919830994463
  • Support: +919830994402
  • Club Support: +916289906895
  • Affiliate: +917003567131
Recent Posts
2 Ethanol Stocks in India
Top 2 Ethanol Stocks in India
Check out the Top 3 Consumption Stocks in India
Top 3 Consumption Stocks in India
Important Links
  • StockEdge.com
  • StockEdge Premium
  • StockEdge Pro
  • StockEdge Club
  • Compare Plans
An Initiative Of
Logo of KREDENT INFOEDGE with SEBI Registration no.

© 2025 Kredent InfoEdge Pvt Ltd.

Facebook-f Twitter Instagram Linkedin-in Youtube Pinterest-p Whatsapp Telegram

Get StockEdge App

No Result
View All Result
  • Home
  • Article Categories
    • Trending Stocks
    • Insights
    • Technical Analysis
    • Fundamental Analysis
    • StockEdge Tutorials
    • Mutual Fund
  • Stories
  • Products
    • StockEdge Premium
    • StockEdge Pro
    • StockEdge Club
  • Visit StockEdge.com

© 2024 Kredent InfoEdge Pvt Ltd.