Table of Contents
Key Takeaways
- Chart Patterns & Reversal Types: Triple top signals a bearish reversal after an uptrend, while triple bottom shows a bullish reversal after a downtrend.
- Triple Top Pattern: Formed by three peaks at similar resistance with dips in between, confirmed when price breaks below support. Stop-loss is at the third peak, and targets are set using the peak-to-support distance.
- Triple Bottom Pattern: Consists of three lows at the same support, validated when price breaks above resistance. Stop-loss is at the third bottom, with targets measured from bottom-to-resistance breakout.
- Using StockEdge: The Chart Pattern feature on StockEdge helps track these setups. Traders should wait for breakout confirmations before taking positions.
- Risk Management: Always confirm with volume or price action, set strict stop-loss levels, and stay patient as these patterns take time to form.
Do you know what is called the combination of art and science? It is none other than “Technical Analysis”. It is a study of both art and science because planning and plotting the price action movements of a stock has a logic behind it, which is scientific, whereas how uniquely you analyze the price chart to identify the buy/sell signal in a stock is the art.
One such method to analyze price charts is “Classical Chart Patterns”. There are numerous chart patterns in technical analysis, out of which, in this blog, the triple top pattern and the triple bottom pattern will be explained with practical examples. So, you can just spot a triple top pattern/ triple bottom pattern and take action on trading the two most popular chart patterns in technical analysis.
But what exactly are chart patterns in technical analysis? Let’s find out!
What are Chart Patterns?
In technical analysis, chart patterns are graphical representations of the stock price movements. These chart patterns are formed by the historical price data plotted on a chart and are used by traders to predict future price action movements of a stock. Some common examples are triple top pattern and triple bottom pattern, double top and double bottom pattern, flags, pennants, head and shoulders, etc.
For a beginner, spotting these chart patterns can be challenging. So, at StockEdge, we have developed a method to spot chart patterns using artificial intelligence (AI). Our AI models identify chart patterns on the price chart so that you don’t miss a trading opportunity.
Categories of Chart Pattern
In technical analysis, chart patterns are divided into two broad categories, which are as follows:
- Continuation Pattern
A formation of a continuation chart pattern suggests that the ongoing trend of a stock may take a pause, and then a breakout or a breakdown of the pattern is most likely to follow the same trend of a stock. Irrespective of whether a stock is in an up trend or down trend, these chart patterns form in the middle of a trend and after the completion of the continuation pattern, the stock resumes its ongoing trend. Chart patterns can be found in any time frame, like daily, weekly, monthly or even hourly time frames. Some examples are flags, pennants, etc.
- Reversal Pattern
A formation of any reversal pattern indicates the trends of stock are most likely to reverse. For instance, if a stock is in an upward trend and forms a triple top pattern, which is a reversal pattern, the trend of a stock will now reverse to a downtrend. In contrast, when there is the formation of a triple bottom pattern, it is usually in a downtrend and post-completion of the pattern, the trend of the stock gets reversed.
Some examples of reversal patterns are, as mentioned already, triple top patterns and triple bottom patterns, double top patterns and double bottom patterns, head and shoulders patterns, etc.
What is a Triple Top Pattern?
The triple top pattern in technical analysis consists of three successive peaks formed at roughly the same price level, with minor pullbacks in between. These peaks signify a strong resistance zone where the stock struggles to move higher, while the pullbacks represent temporary declines before the price rebounds to attempt another peak. This pattern indicates a potential reversal as the stock repeatedly fails to break through the resistance level.
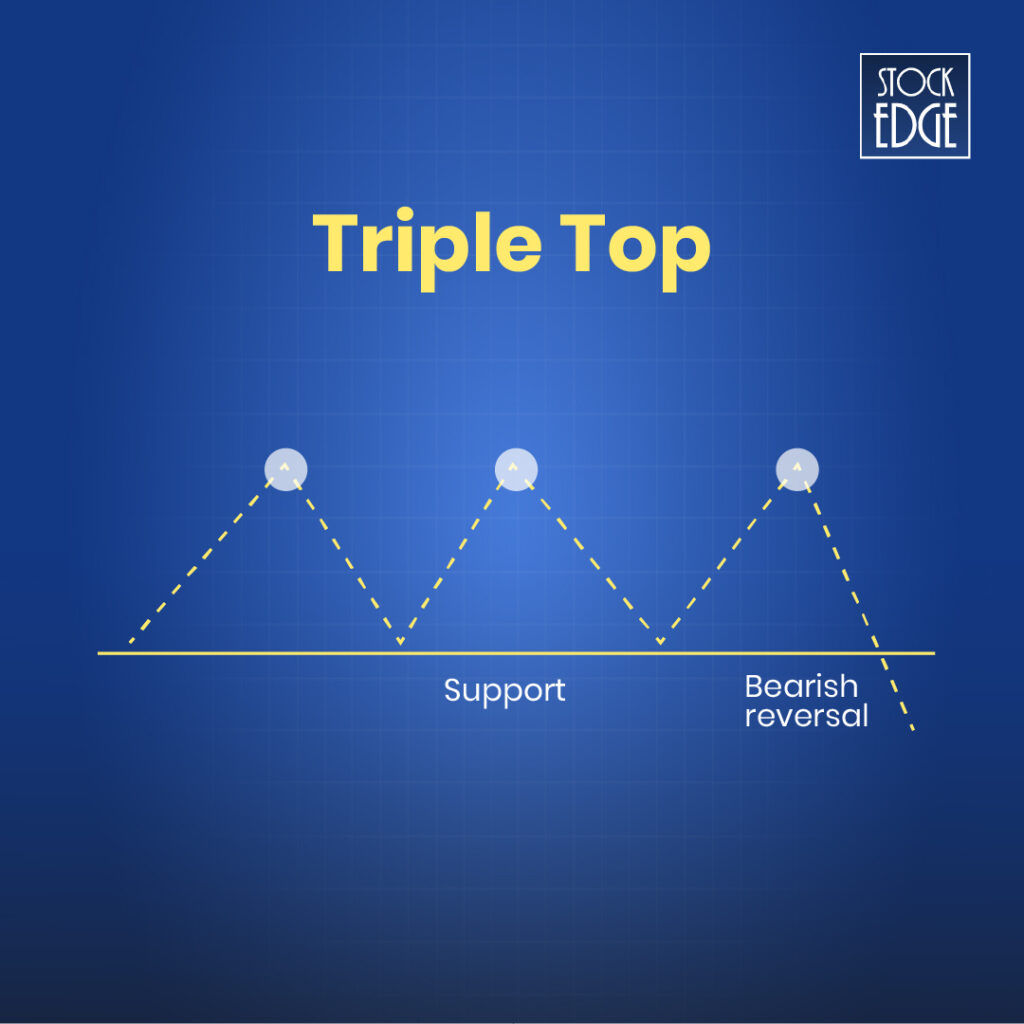
As you can see in the above illustration, when stock breaks below the support, a bearish reversal triple top pattern has formed.
Interpretation of a Triple Top Pattern
- Initially, the price rises until it reaches a resistance level, after which it reverses and moves down to a support zone.
- Next, the price makes another attempt to break through the resistance level but fails again, retracing to the support area.
- Finally, the price makes a third effort to surpass the resistance but is unsuccessful, resulting in a decline once more and eventually breaking below the support level indicates the probability of continued decline in stock price.
How to trade Triple Top Pattern?
First and foremost, you need to spot a triple top formation on a stock from the list of almost 6000+ traded in both NSE and BSE. Yes, it seems to be a very difficult task to find out a triple top pattern breakdown or even any other chart pattern breakout.
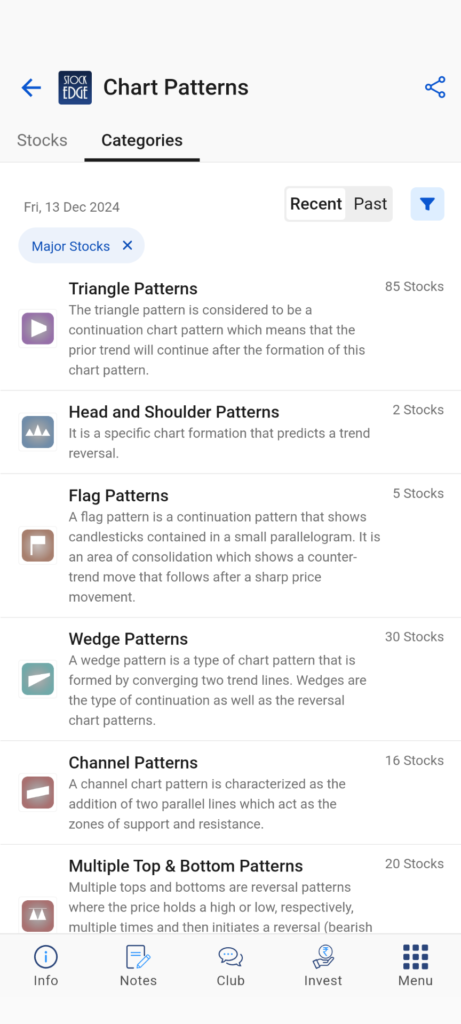
That’s why you have the StockEdge Chart pattern feature. You can easily spot any chart pattern and make trading decisions quickly. Follow the simple steps as mentioned below:
- Go to https://web.stockedge.com/ or open the StockEdge App
- Click on the Analytics tab and select Chart Pattern
- You can now view the list of stocks where chart patterns are formed. (both recent/past)
Once you spot a triple top pattern on the recent list, open up the price chart. You can enter short trade once the stock breaks below the support level. A triple top pattern is a bearish reversal pattern, and a breakdown below the support indicates further decline. So, you can enter a short trade once the price breaks below the support level.
Here is a practical example:
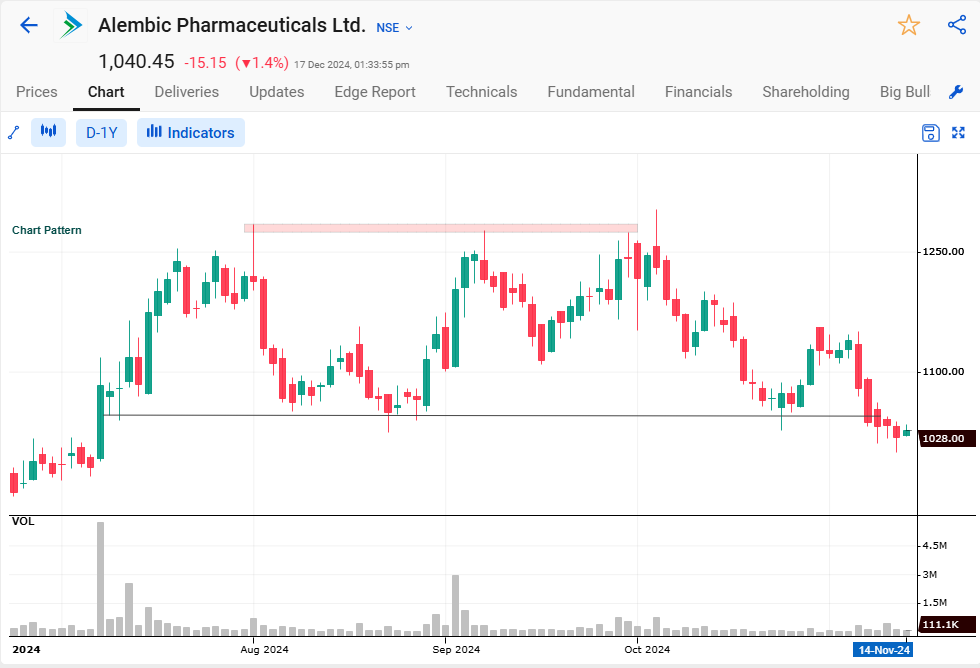
In the StockEdge Chart pattern, Alembic Pharmaceuticals Ltd. formed a triple top pattern on 7th Oct 2024, and since then, the stock has declined.
But what should the entry, target, and stop loss be for the triple top pattern?
Entry: Once the stocks break below the support level, you can enter the trade
Target: The distance between the tops and the support level from the breakdown point becomes the target for the triple top pattern.
Stop Loss: The peak of the third top is ideally considered as stop loss for the triple top pattern.
What is a Triple Bottom Pattern?
Unlike the triple top pattern, this particular pattern formed after a downtrend and indicates a bullish reversal pattern. The triple bottom pattern in technical analysis consists of three successive bottoms or lows formed at roughly the same price level, with minor pullbacks in between. These lows signify a strong support zone where the stock repeatedly struggles to go lower, while the pullbacks in between represent a temporary bounce back before the price rebounds to attempt another bottom. This pattern indicates a potential reversal as the stock repeatedly fails to break below the support level.
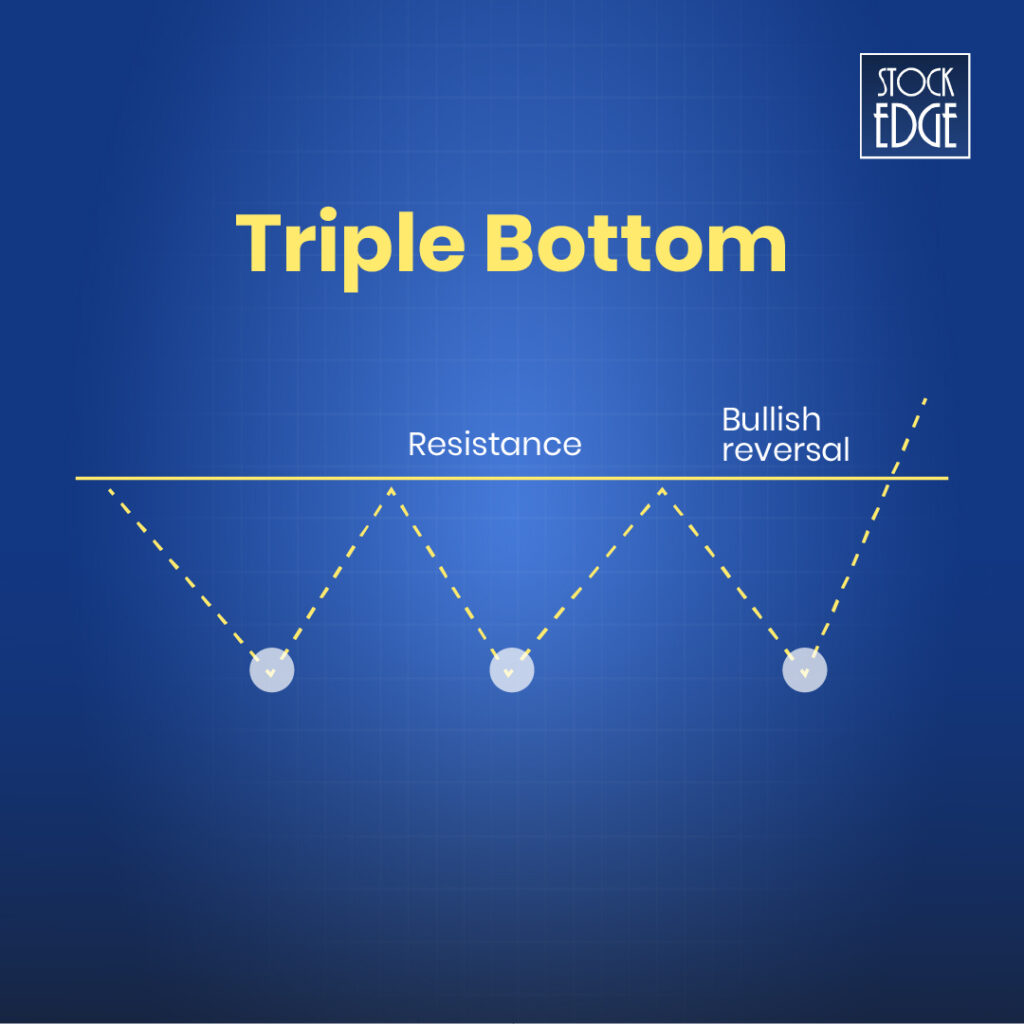
As you can see in the above illustration, when a stock breaks above the resistance level, a bullish reversal triple bottom pattern is formed. It is indeed very similar to the triple top pattern, with the only difference being one signifies a bearish reversal pattern, and the other signifies a bullish reversal pattern.
Interpretation of a Triple Bottom Pattern
The interpretation of a triple bottom pattern involves three main stages:
- First, the price declines to a support level, where it finds a temporary floor and bounces back toward a resistance zone.
- Next, the price drops again to retest the same support level but holds firm, rebounding toward resistance once more.
- Finally, the price dips to the support level a third time, fails to break below it, and begins to rise, signaling a potential upward reversal eventually breaking above the resistance level.
How to trade Triple Bottom Pattern?
As spotting a triple bottom can be extremely difficult, StockEdge can guide you in identifying any chart pattern by implementing artificial intelligence. As mentioned above, simply go to StockEdge and get the list of stocks that have recently formed a triple bottom pattern.
Here is a practical example:
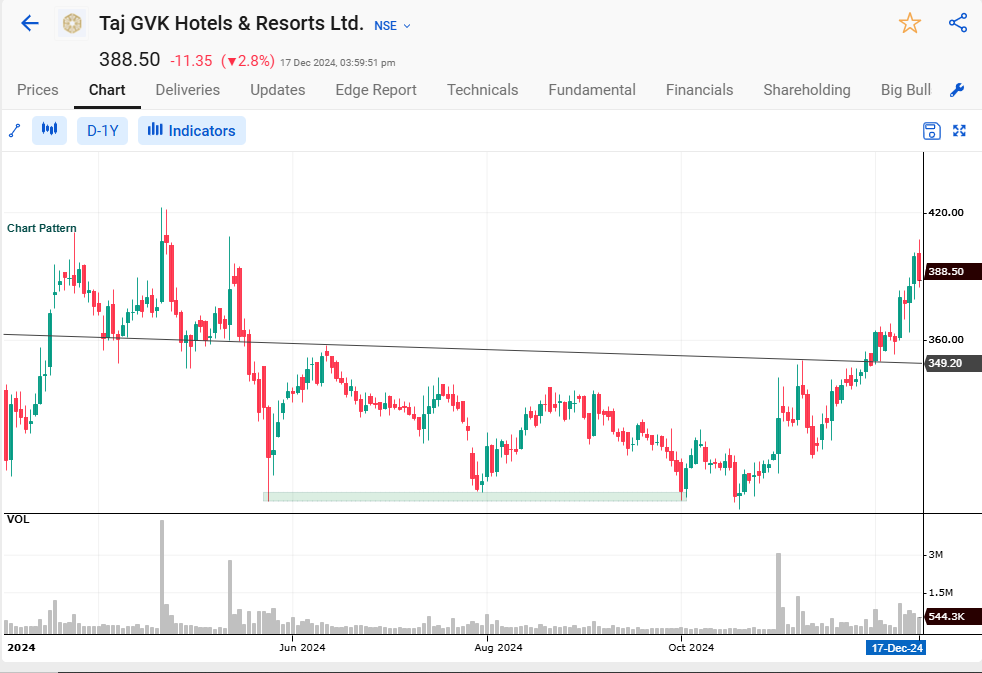
In the StockEdge Chart pattern, Taj GVK Hotels & Resorts Ltd. formed a triple bottom pattern on 9th Oct 2024, and since then, the stock price increased.
But what should the entry, target, and stop loss be for the triple bottom pattern?
Entry: Once the stocks break out above the resistance level, you can enter the trade.
Target: The distance between the bottoms and the resistance level from the breakout point becomes the target for the triple bottom pattern.
Stop Loss: The low of the third bottom is ideally considered as stop loss for the triple bottom pattern.
Learn more such chart patterns and how to trade them using StockEdge: Chart Patterns – Holy grail of Stock Market Analysis
The Bottom Line
In conclusion, understanding the triple top pattern and the triple bottom pattern is essential to anticipate potential trend reversals in the stock. These chart patterns highlight key resistance and support levels, offering valuable insights into the sentiment and potential price movements of a stock. By identifying these chart patterns early, traders can make informed decisions on entry, exit, and risk management strategies. The StockEdge app makes spotting these patterns easier by providing analytic tools implementing artificial intelligence, enabling you and many traders to analyze charts effectively and enhance their trading strategies with confidence.
Happy trading!


