- Basics of Candlesticks
- What are Reversal Candlestick Patterns?
- Why Reversal Candlestick Patterns?
- How Do You Identify Reversal Candlestick Patterns?
- Types of Reversal Candlestick Patterns
- How Can You Trade Any Reversal Candlestick Patterns?
- Bullish Reversal Candlestick Patterns
- Bearish Reversal Candlestick Patterns
- Conclusion
There is a popular saying in the stock market “Bhav Bhagwan Hai” which means price action moves are supreme in the market and the best way to analyze the price action movement of a stock is to study the candlestick charts. There are many candlestick patterns, which signifies various price patterns. Some show bullish or bearish reversal candlestick patterns and other candlestick patterns showcase continuity of trend.
Now for a retail trader or if you are a beginner in trading, analyzing reversal candlestick patterns could provide you with a greater margin of safety. But how?
This blog will explain how to trade any reversal candlestick pattern. Not just that, even if you are a beginner, this blog will start from the basic study of candlestick charts so that you can have a strong foundation in analyzing or spotting reversal candlestick patterns.
Basics of Candlesticks
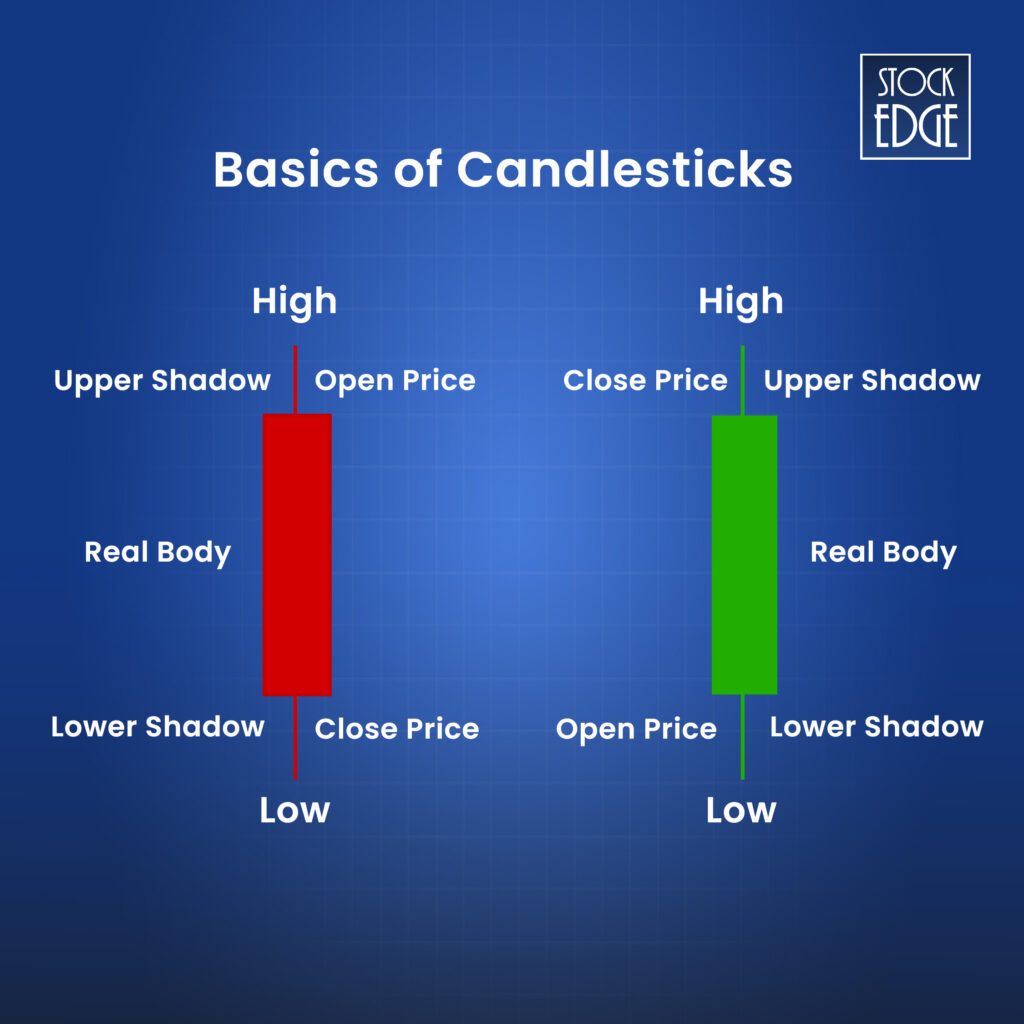
Candlestick pattern is the study of price action moves that was developed by a Japanese rice trader named Munehisa Homma in the 18th century. A candlestick pattern could be bullish or bearish. In the most basic form, a candlestick shows the Open, High, Low and Close of a stock price. So, when a price closes above its opening price, it is denoted by a green candle, which is considered to be bullish, whereas when a price closes below its opening price, then it is denoted by a red candle, which is considered to be bearish. A candle has upper and lower wicks, also known as the shadows of a candle, which denote the high and low of a stock.
Here is an illustration of a bullish and bearish candlestick:
You can also read How to Use StockEdge Candlestick Scans to understand this better
Now that you have a basic understanding of a candlestick let’s jump into the study of reversal candlestick patterns.
What are Reversal Candlestick Patterns?
There are three major trends which a stock price follows, either it is an upturned, downtrend or sideways. Reversal candlestick patterns spot the change in direction of a stock trend. Therefore it becomes easier to know when the stock price can reverse and accordingly you can take an entry or exit in a stock.
Why Reversal Candlestick Patterns?
There is a wide variety of candlestick patterns that indicate different price action movements of a stock. However, reversal candlestick patterns have the added advantage of spotting probable reversals in stock price, which offer quick entry at a lower price with a better margin of safety. A common saying, “Buy Low- Sell High”, can actually be achieved if you spot bullish reversal candlestick patterns. Yes, reversal candlestick patterns can be bullish or bearish.
Take a look at an example here:
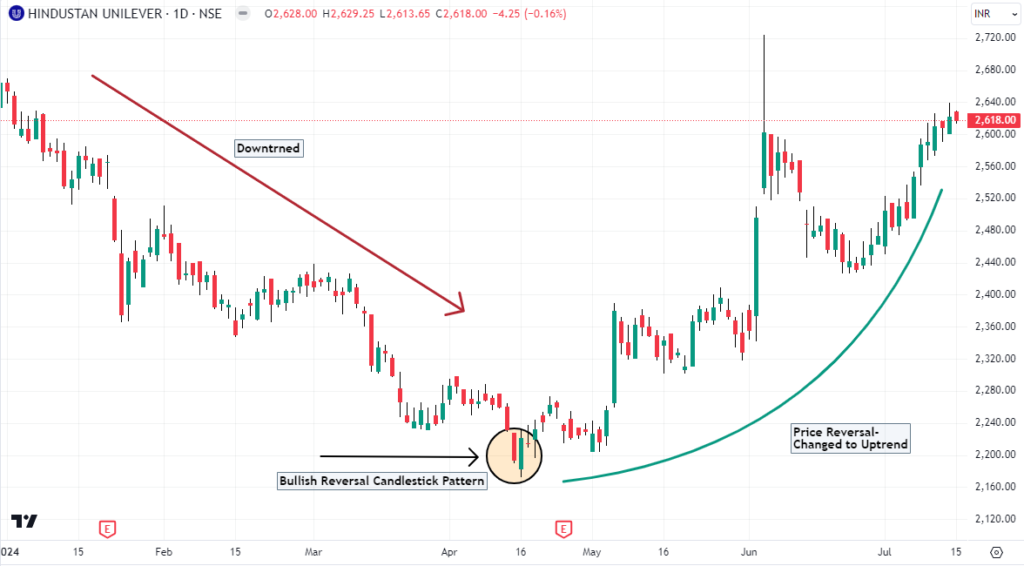
This is the daily chart of Hindustan Unilever Ltd. As you can see, the price was earlier in a downtrend. But once it formed a piercing line bullish reversal candlestick pattern, the stock price made a reversal. Imagine you enter a trade post the reversal candlestick pattern, your downside is minimal. Hence spotting bullish price reversal candlestick patterns has the potential to identify trades with relatively lower risk and it is best suited for retail traders or someone who is a beginner in trading.
How Do You Identify Reversal Candlestick Patterns?
Identifying these reversal candlestick patterns can be extremely difficult, tedious, and time-consuming if you are ready to track each stock listed in the stock market. There are more than 6000 listed stocks that are traded in both the NSE and BSE. Therefore, going through each stock in multiple time frames to check for reversal candlestick patterns can be very difficult for many traders.
Worry not! Using StockEdge, you can easily scan these reversal candlestick patterns or any other candlestick patterns formed on a daily chart. Go to https://stockedge.com/ to log in through your app or https://web.stockedge.com/app/markets.
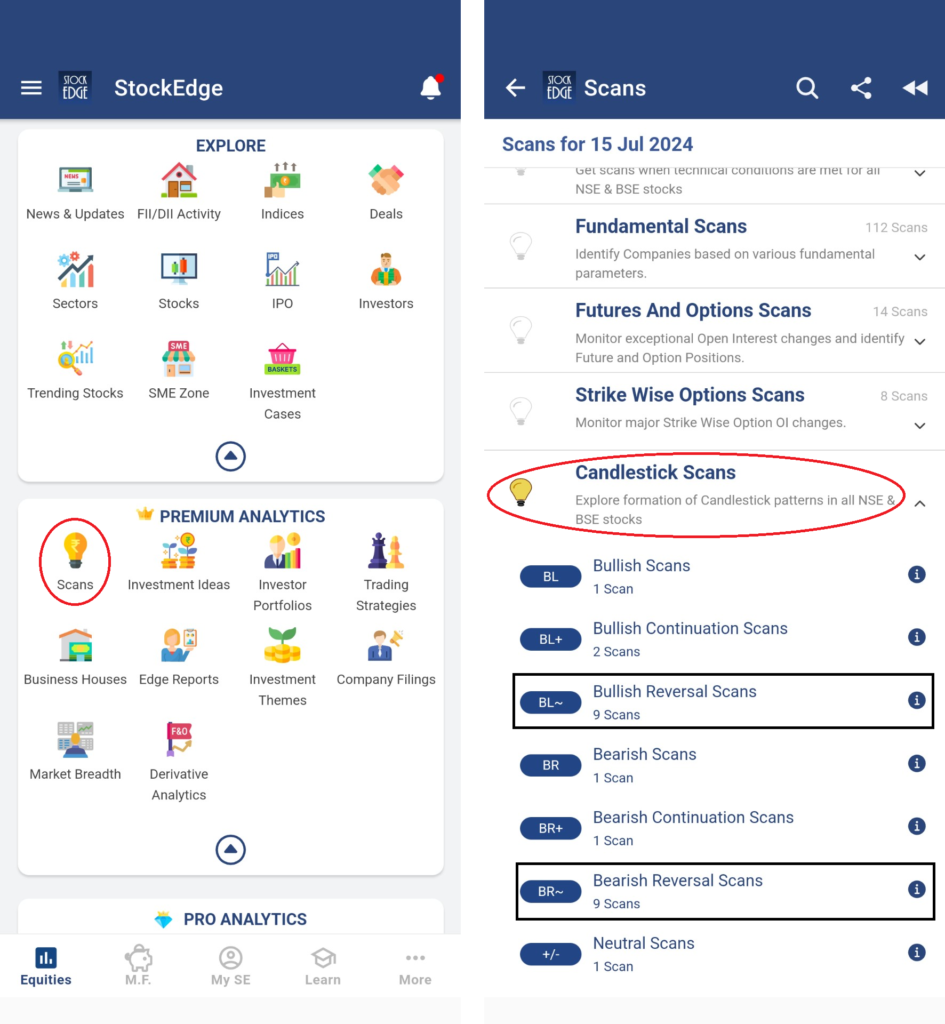
As you can see, using candlestick scans, you can identify any type of candlestick patterns that form on daily charts. You can see from the screenshot that there are various candlestick patterns available to you. However, this blog will focus only on reversal candlestick patterns and how you can trade if you spot these candlestick patterns.
Types of Reversal Candlestick Patterns
As mentioned earlier, there are broadly two categories for reversal candlestick patterns. They are:
In the next section, you will learn some of the best reversal candlestick patterns. One by one, bullish and bearish reversal candlestick patterns will be explained, along with examples for your reference. Please note that there are different types of reversal candlestick patterns under bullish and bearish. However, the question still remains: even if you spot any reversal candlestick patterns using StockEdge scans, where and how should the trade be initiated?
How Can You Trade Any Reversal Candlestick Patterns?
There is a simple and easy way to trade any reversal candlestick patterns. Of course, every individual trader has its own way of trading the markets. But if you are looking to initiate a trade based on any reversal candlestick patterns, then there is no better way. Having said that, the method that is explained below can be implemented on bullish or bearish reversal candlestick patterns.
First and foremost, once you spot a reversal candlestick pattern on the chart, you need to mark its high and low of the candle. Now, some candlestick patterns are even formed with two or more candles in combination, then you must mark the combination high and low of the candlestick pattern.
Now, you need to wait for the formation of the next candle. For instance, in a bullish reversal candlestick pattern, if the next candle is a bullish green candle and gives a breakout above the combined high of the candlestick pattern, then initiates a long entry with an initial target, the distance between the combined high and low of the pattern. The stop loss could be the low of the candlestick pattern. This will give you a risk-reward of 1:1.
Similarly, for a bearish reversal candlestick pattern, if the next candle gives a breakdown with a bearish candle below the low of the candlestick pattern then it indicates a weakness in the stock where you can take a short position using futures and options or you may book profit in case you are already holding the stock in your portfolio.
Do not worry if you are confused with the method, going forward bullish and bearish reversal candlestick patterns will be explained in detail with examples. So, first let’s start with the bullish reversal candlestick patterns.
Bullish Reversal Candlestick Patterns
A bullish reversal candlestick pattern is formed after a downtrend that signifies the end of it and indicates a probable trend reseaval in the stock. It provides an opportunity to accumulate the stock at the start of a fresh up trend. There are various bullish reversal candlestick patterns, but here the top 5 bullish reversal candlestick patterns will be explained and you can scan each candlestick pattern using StockEdge Scans.
Top 5 Bullish Reversal Candlestick Patterns
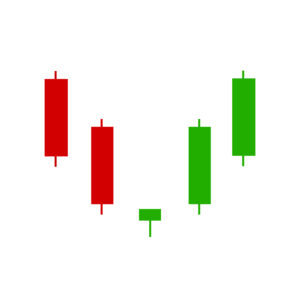
It is a bullish reversal candlestick pattern that usually formed after a downtrend. The candlestick has a small real body but has a long lower shadow which is greater or equal to twice the real body and it has a small or negligible upper shadow. Although the real body can be green or red, a candlestick with green candles indicates a greater conviction on price reversal.
Here is an illustration of a bullish hammer candlestick pattern:
Now, let’s take a real life example on price chart:
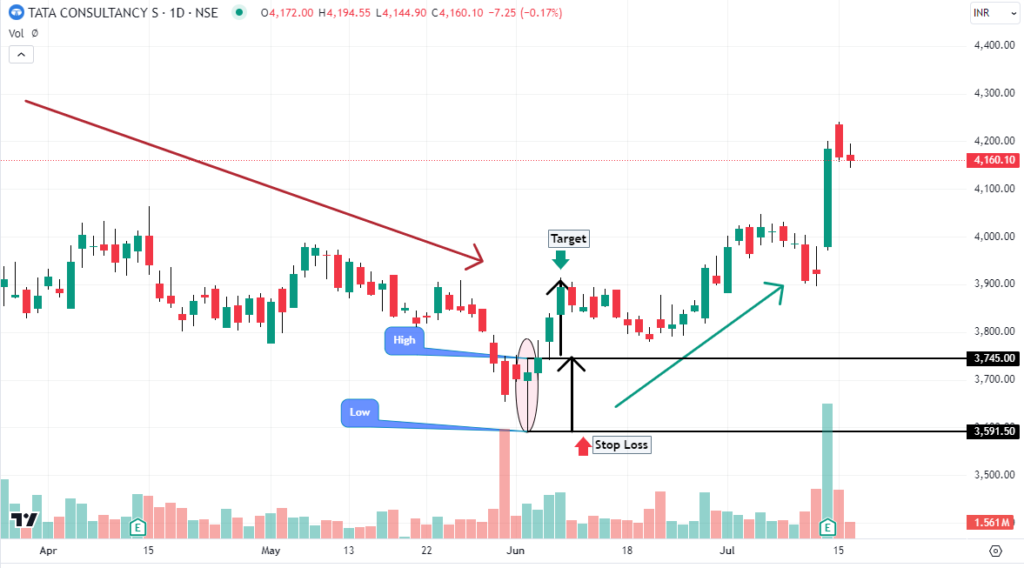
For example, here is the daily chart of Tata Consultancy Services Ltd. The stock was in a downtrend, and once it formed a bullish hammer, the stock price took a U-turn, after which the trend reversed. You can initiate a long trade once it crosses the high of the hammer for an initial target of the distance between the high and low of the hammer, and stop loss could be the low of the bullish hammer.
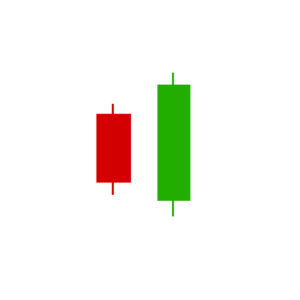
This reversal candlestick pattern consists of two candles. The first one is a red candle and the next one is a green candle which engulfs which means it covers the entire body of the previous red candle.
Here is an illustration of a bullish engulfing candlestick pattern:
Now, let’s take a real life example on price chart:
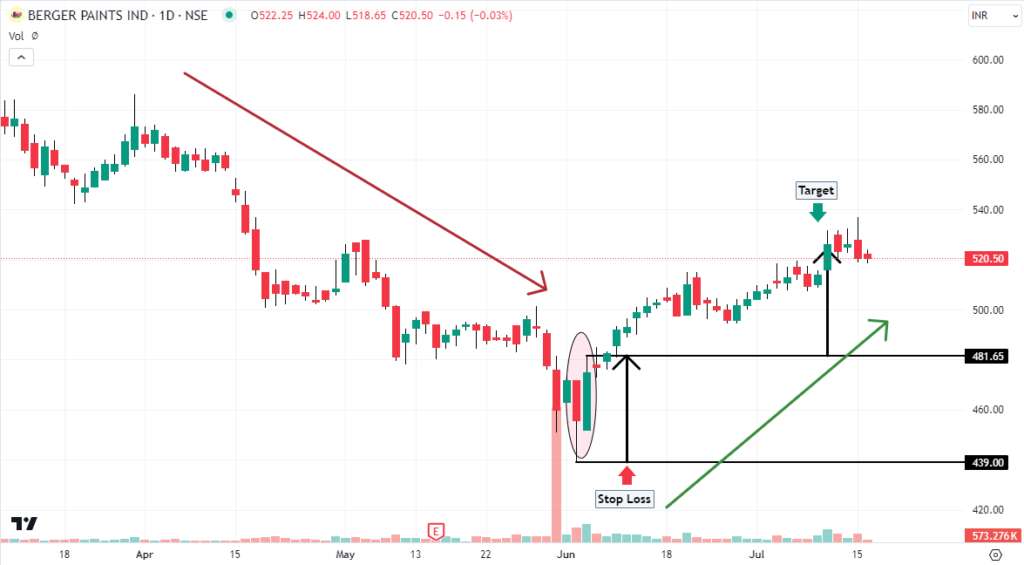
In the above example, on the daily chart of Berger Paints Ltd., a bullish engulfing candlestick pattern has formed, and once it crosses the high of the candlestick pattern, a long trade can be initiated.
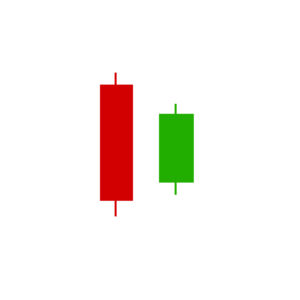
The word “Harami” in Japanese refers to pregnant women. This pattern consists of two candles that appear after a downtrend. The first candle is a red bearish candle, and the next candle is a small bullish green candle where the entire body and the wicks are entirely inside the highs and lows of the previous red candle.
Here is an illustration of a bullish harami candlestick pattern:
Now, let’s take a real life example on price chart:
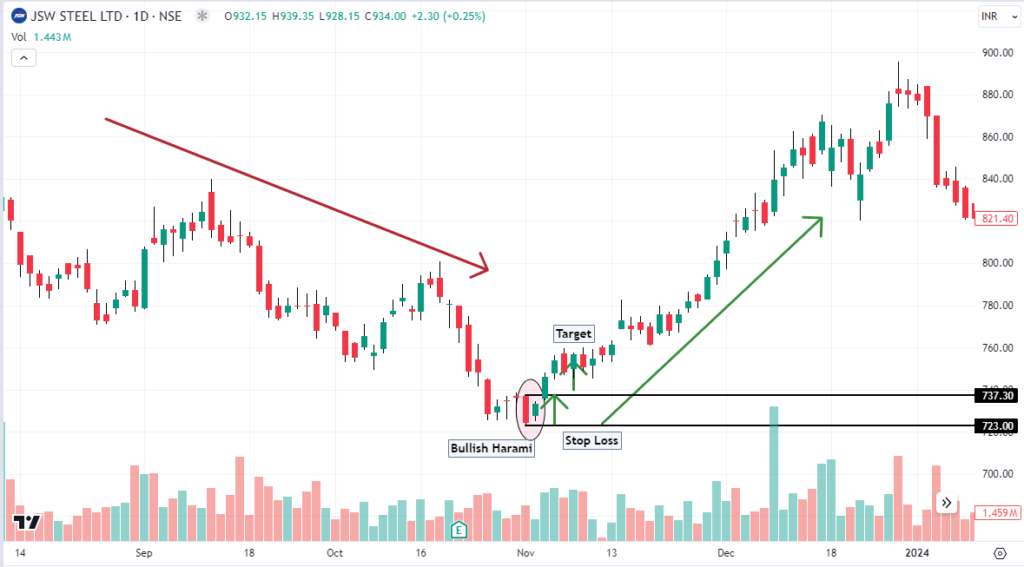
In the above example, it is the daily price chart of JSW Steel Ltd., where a bullish harami candlestick pattern formed, after which the ongoing downtrend of the stock made a reversal.
The piercing line is made up of two candlesticks, where the first one is a bearish candle signifying the ongoing downtrend in a stock and the second candle is a bullish green candle which should cover at least 50% line of the first candle’s body after starting from below the first candle’s body.
Here is an illustration of a Piercing Line candlestick pattern:

Now, let’s take a real life example on price chart:
Remember, the example of the bullish reversal candlestick pattern in Hindustan Unilever Ltd. was the piercing line candlestick pattern.
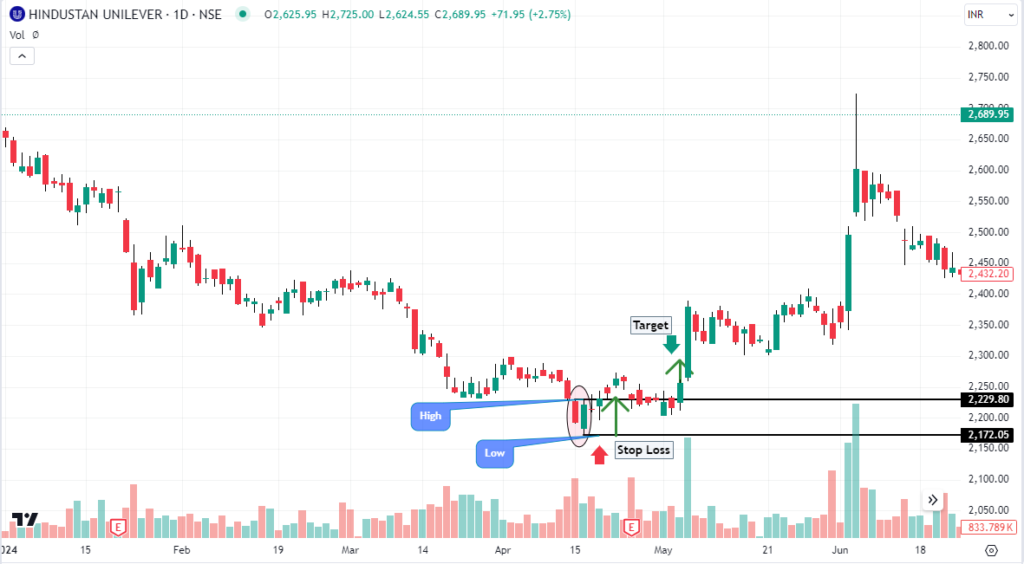
In the above example, a piercing line candlestick pattern is formed and crossing the high pattern, a long trade can be initiated.
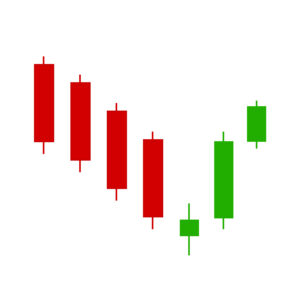
This pattern consists of three candles where the first candle is bearish, the second candle can be either green or red and formed after a gap down, it has to have a small real body. The third (green) should appear after a gap up and cross 50 % of the first candle’s real body which indicates the trend is about to reverse.
Here is an illustration of a morning star candlestick pattern:
Now, let’s take a real life example on price chart:
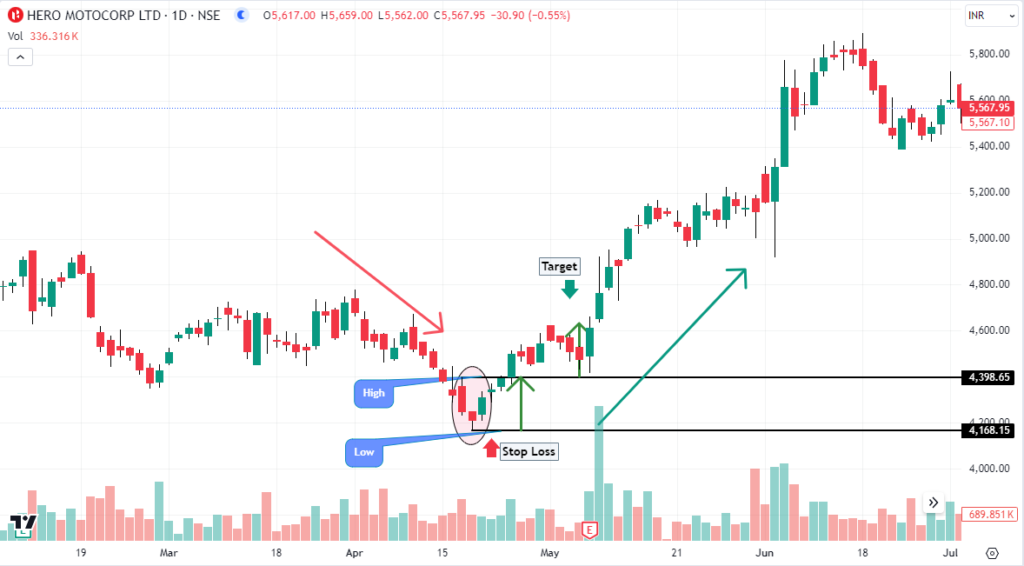
In the above example of Hero Motocorp Ltd. there is a morning star candlestick pattern formed and after marking the combined high and low of the pattern, a long trade can be initiated once it crosses the high.
Bearish Reversal Candlestick Patterns
Now, let’s dive into the bearish reversal candlestick patterns. These patterns generate a sell signal when they are formed in an up-trending stock. However, the bearish reversal candlestick patterns may not be that helpful for traders who only trade in the cash market segment because they cannot carry forward short positions overnight in the cash segment. Only F&O trades can create short positions and can hold it overnight till the expiry.
Therefore, if you are someone who is not dealing with futures and options, then spotting the bearish reversal candlestick patterns can only help you identify levels of profit booking for your stocks that are in your portfolio. No matter what, having the knowledge of both sides is important in trading. So, let’s start with the top 5 bearish reversal candlestick patterns and each pattern can be identified using StokEdge Scans.
Top 5 Bearish Reversal Candlestick Patterns
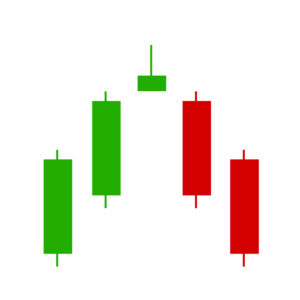
A shooting star usually forms at the end of an uptrend. The candlestick has a long upper shadow that is greater or equal to twice of the real body, although the body can be green or red but a bearish red candle will have more conviction on the reversal of the trend.
Here is an illustration of a shooting star candlestick pattern:
Now, let’s take a real life example on price chart:
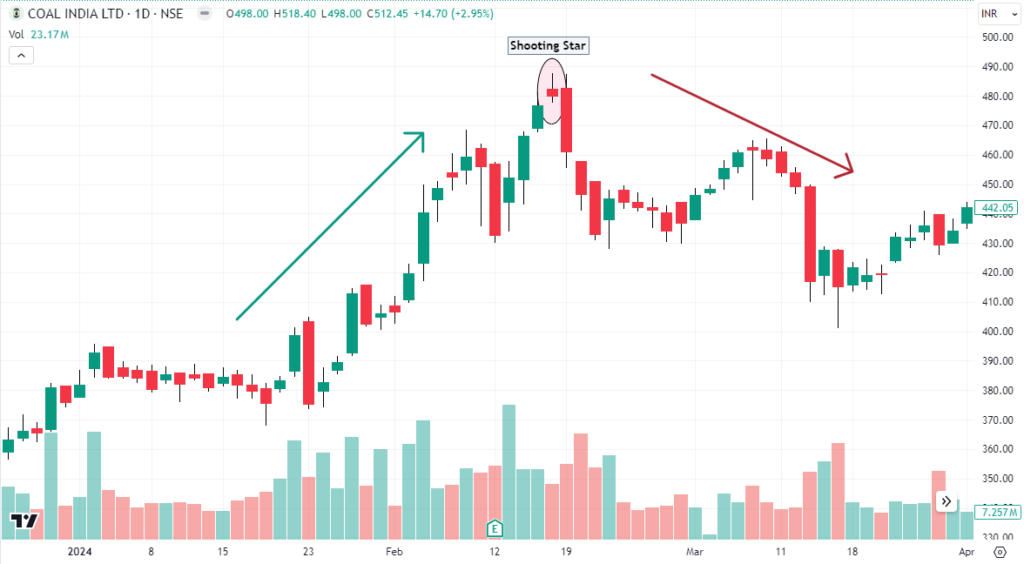
In the above daily chart of Coal India Ltd. a shooting star candle formed which marked the reversal of an ongoing up trend in the stock.
Now, if you are into futures trading, then marking the same high and lows of the shooting start, you may initiate a short trade in Coal India futures where your initial target becomes the distance between high and lows from the price breakdown and stop loss remains the candle’s high.
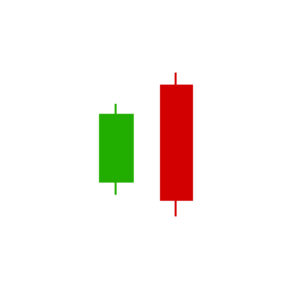
This pattern consists of two candles which appear after an uptrend. The first candle is a bullish green candle which suggests the up trend is ongoing and the second candle becomes the long bearish red candle which engulfs the entire real body of the previous candle indicates a probable reversal of a trend.
Here is an illustration of a bearish engulfing candlestick pattern:
Now, let’s take a real life example on price chart:
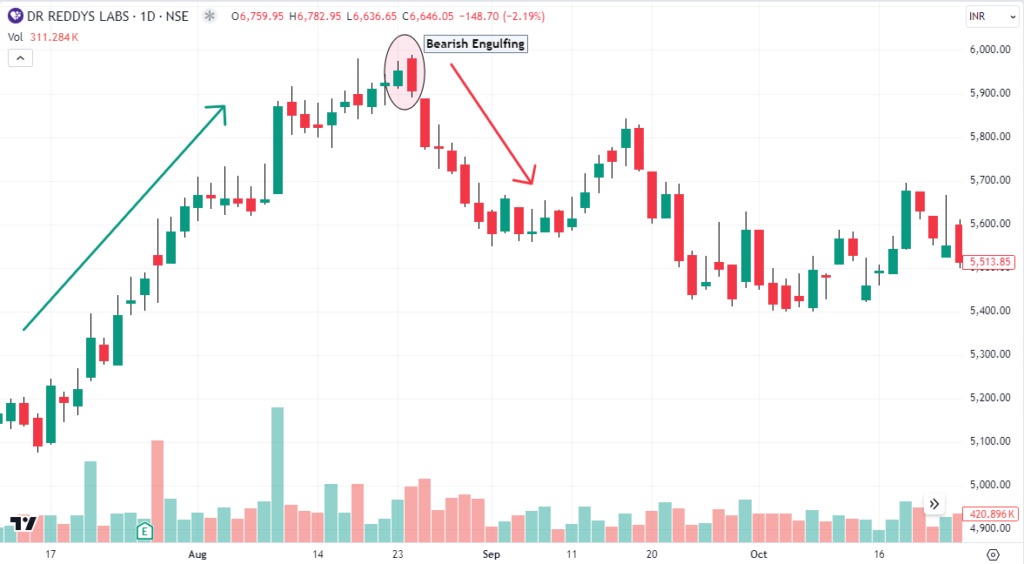
In the above example, look at how there is a strong trend reversal on the daily chart of Dr Reddy’s Ltd. Once the price gave a breakdown below the low of the candlestick pattern, there was a sharp decline in the stock.
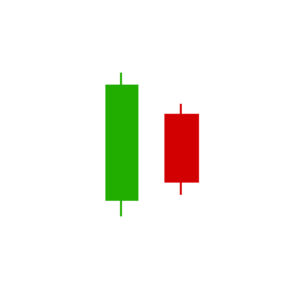
This is similar to the bullish harami pattern, as explained earlier. It is also a two-candlestick pattern, where the first candle here is a long bullish candle representing the ongoing uptrend. The second candle is a bearish inside bar, suggesting a bearish reversal in the trend.
Here is an illustration of a bearish harami candlestick pattern:
Now, let’s take a real life example on price chart:
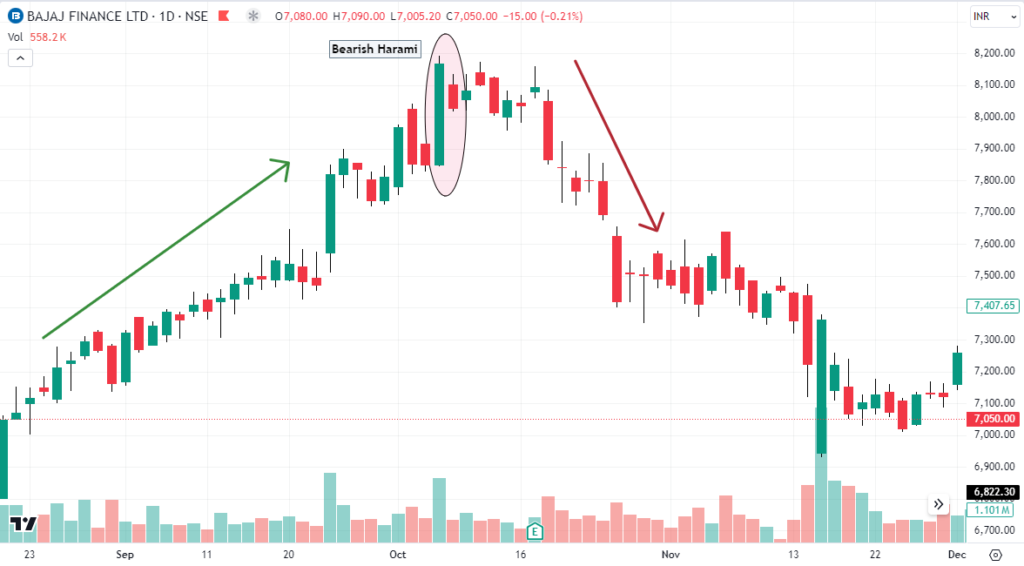
As you see on the daily chart of Bajaj Finance Ltd., the stock was in an up trend; it formed a bearish harami candlestick pattern, after which the up trend reversed.
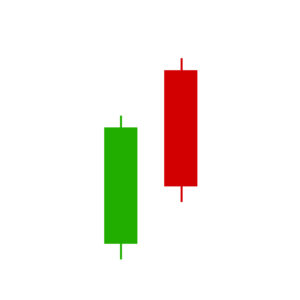
You can think of dark cloud cover as the bearish version of a piercing line candlestick pattern. This is also a two-candlestick pattern, where the first candle is bullish and the second candle on the next day gives a gap-up opening above the first candle’s high but faces huge selling pressure to close below covering 50% of the first candle’s body. This marks the bearish reversal in an ongoing trend of a stock.
Here is an illustration of a dark cloud cover candlestick pattern:
Now, let’s take a real life example on price chart:
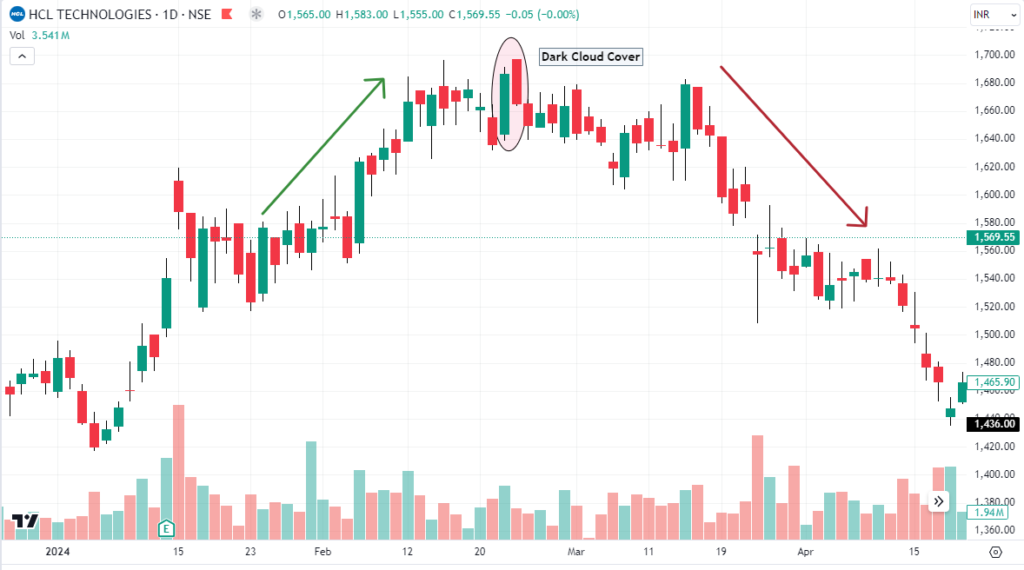
In the daily price chart of HCL Technologies Ltd. you can see it formed a dark cloud cover candlestick pattern after which price declined gradually making a reversal in the ongoing trend.
- Evening Star
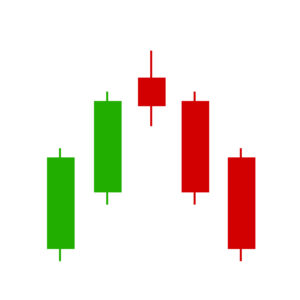
This candlestick pattern is exactly the opposite of morning star as the name suggests indicating it as a bearish reversal candlestick pattern. This pattern formation consists of three candles. The first candle is a bullish candle representing the ongoing up trend. The second candle gives a gap up opening forming a candle with a small real body which can be bullish or bearish. The third candle is a bearish red candle that appears after a gap down and crosses the 50 % line of the first candle’s body.
Here is an illustration of an evening star candlestick pattern:
Now, let’s take a real life example on price chart:
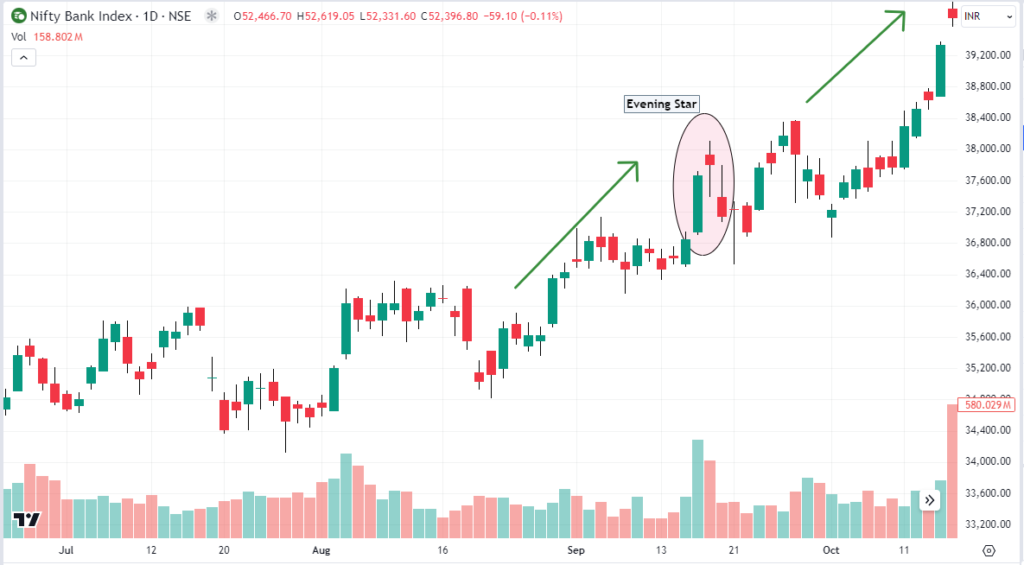
This is the daily chart of the Bank Nifty Index. Although it formed an evening star in an ongoing uptrend, it has failed to give a bearish reversal. Yes, there are occurrences when candlestick patterns fail. Therefore, you must not rely only on candlestick patterns; you must look for other indicators before entering a trade. You can read about technical indicators for trend analysis from this blog – Top 3 Technical Indicators for Trend Analysis
Conclusion
In the end, Reversal Candlestick Patterns are extremely powerful, which provides you with an indication of probable price reversal in a stock, index, or any other financial instrument, for that matter. Yes, Japanese candlestick patterns are applicable to the technical charts of stocks, indices, commodities, and currencies. Do note that even candlestick patterns could fail in certain situations, as showcased in our last example. Therefore, you need to study other technical parameters that could add more conviction to your trade.
Also Read: How To Trade Using Continuation Candlestick Scans?
Happy trading!


