Table of Contents
Key Takeaways
- Quick stock discovery: StockEdge Technical Scans help traders instantly filter stocks using proven technical rules, removing the need to manually check multiple charts.
- Structured categories for easy use: These technical scans are neatly organised into Trend, Momentum, Volume, and Volatility, making it simple to pick setups based on trading style.
- AI-powered Momentum Score: The Momentum Score blends short-, medium-, and long-term trend strength to highlight stocks with consistent directional movement.
- Deep indicator-based screening: From Moving Averages and RSI to Bollinger Bands, ATR, SuperTrend, and Narrow Range setups, each indicator includes multiple scans for precise entries.
- Made for beginners and pros: StockEdge Technical Scans simplify complex chart analysis into ready-to-use insights, helping traders spot high-quality opportunities faster and with more confidence.
There is a time when you have to check a dozen charts to try to find stocks that look promising. You zoom in, zoom out, adjust indicators, change timeframes, and yet, the market seems to move faster than your analysis.
By the time you discover a good setup the trade has already played out.
That’s exactly where StockEdge Technical Scans come in to help you save time, stay focused, and catch opportunities before they slip away.
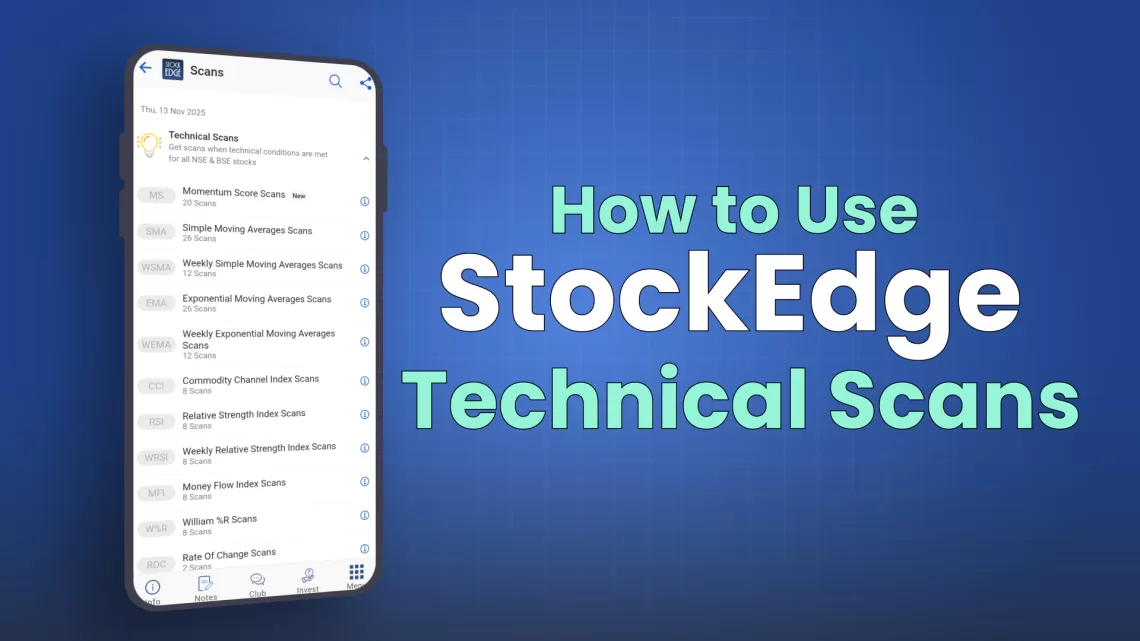
In this blog, we will walk you through everything you need to know about using Technical Scans on StockEdge, from understanding what they are to exploring the different types of technical scans, and finally, learning how to use them effectively to make smarter, faster trading decisions.
What are Technical Scans in StockEdge?
Technical scans are pre-built screeners that help you filter out stocks based on various technical indicators.
How to Use Technical Scans in StockEdge?
Technical analysis becomes powerful only when you can quickly filter the right stocks from thousands of listed companies.
StockEdge Technical Scans solve this exact challenge by providing ready-made, rule-based filters that highlight stocks with strong technical signals.Here is a detailed step-by-step guide that explains exactly how to use technical scans effectively, even if you’re a beginner.
Step 1: Open the StockEdge App or Website
Start by opening the StockEdge app on mobile or visiting the StockEdge website. On the homepage, you will find multiple tabs:
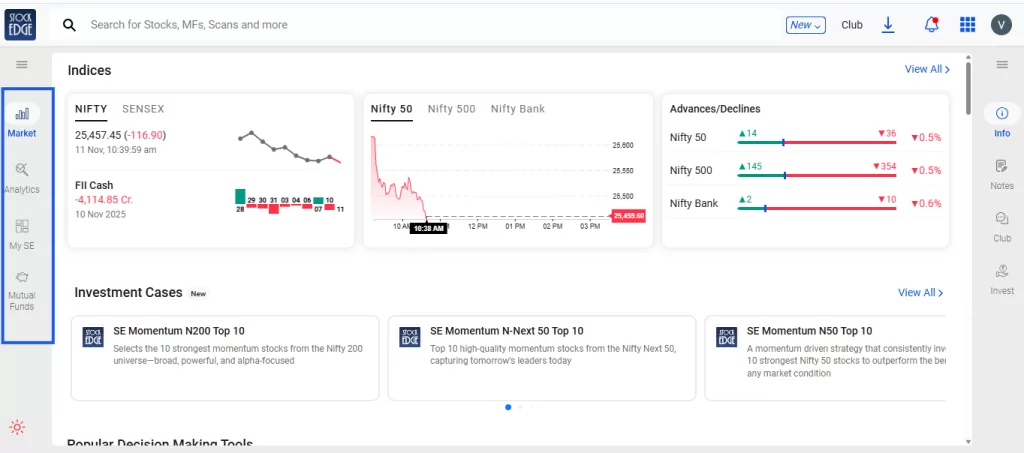
Click on the Analytics tab. This section is the heart of filtering inside StockEdge.
Step 2: Go to the ‘Technical Scans’ Section
When the Analytics page opens, click on ‘scans’.

Inside the Scans section, StockEdge categorizes scans under:
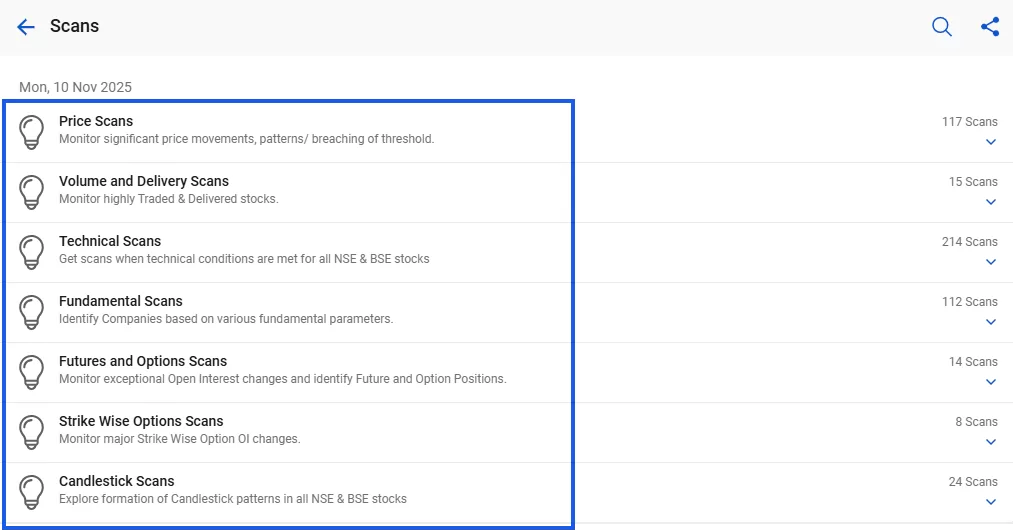
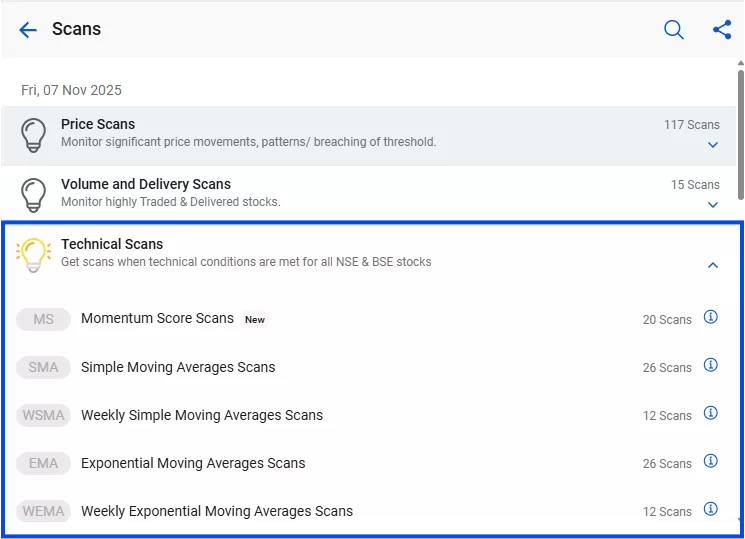
Click on Technical Scans.
Step 3: Explore the Categories Inside Technical Scans
The Technical Scans section is dedicated to rule-based technical indicators such as:

Various Technical Scans by StockEdge
Technical indicators are essential tools for traders who want to understand price behaviour, identify opportunities, and make informed trading decisions. And StockEdge makes this journey faster, smarter, and more data-driven by helping you screen the right stocks at the right time.
Let’s understand how StockEdge makes your journey faster
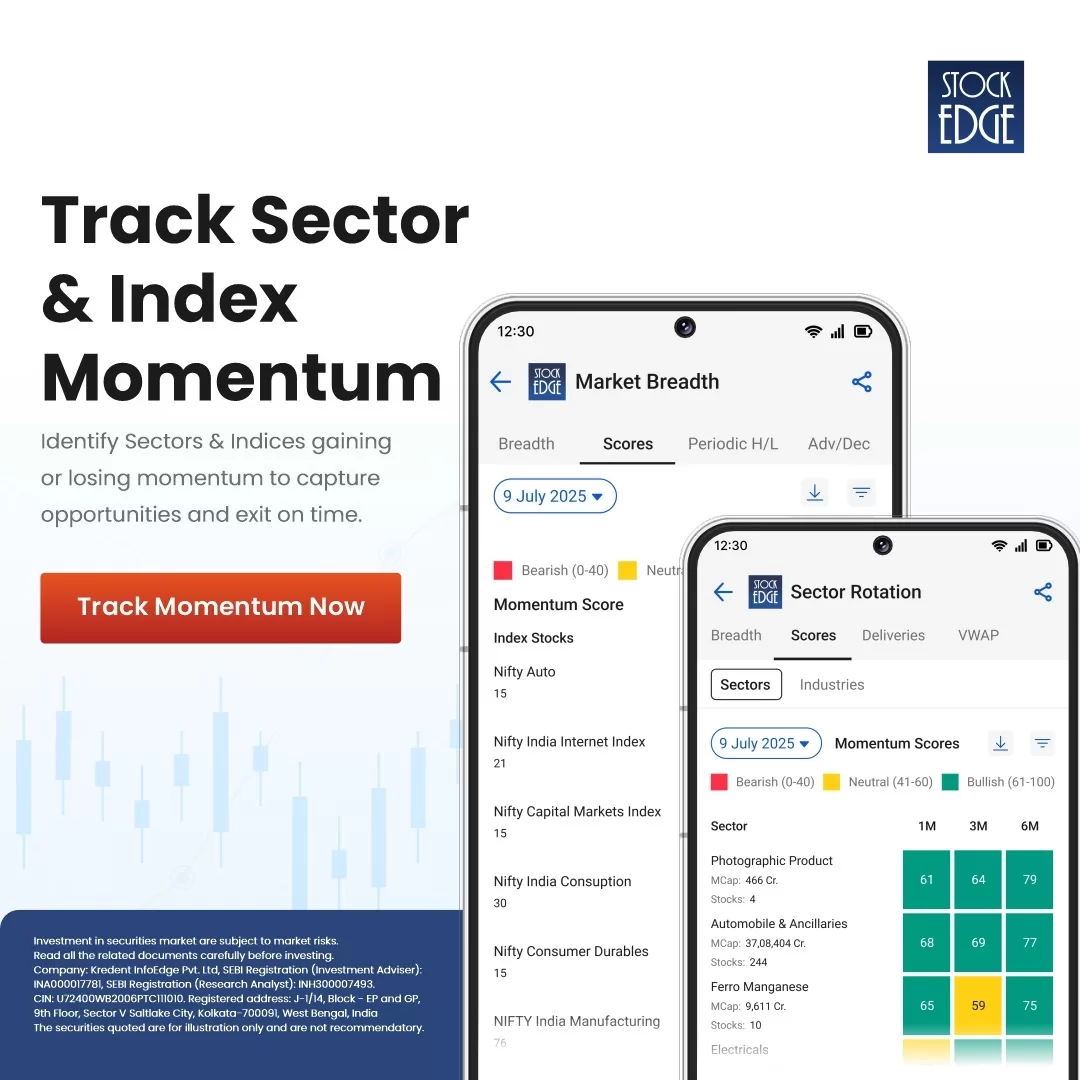
The Momentum Score, developed by StockEdge, is an AI-powered indicator measuring a stock’s price movement strength on a scale of 0-100. It indicates bullish, bearish, or neutral momentum based on recent trends, derived from a complex algorithm analyzing various momentum based technical indicators over 1-, 3-, and 6-month periods. This provides an objective way for traders and investors to assess trend strength without examining multiple charts.
Let’s understand how to use this example. If you are a short-term trader, you may want to check the “Momentum Score (1M) Entering Bullish Zone” scan to identify high-momentum stocks.
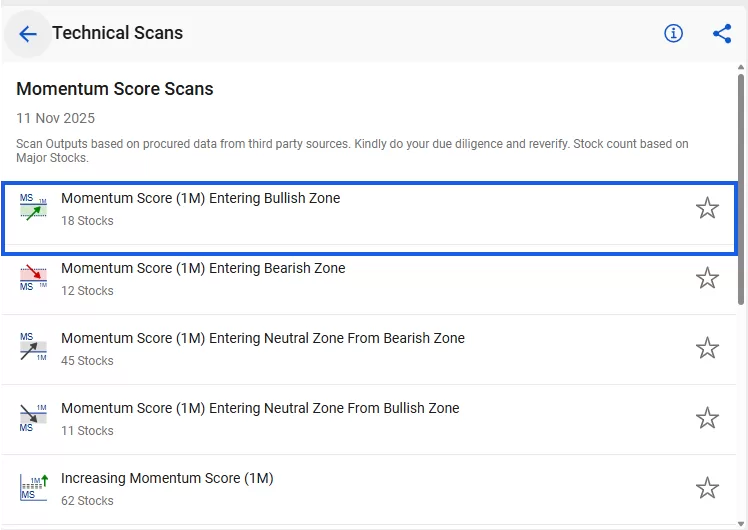
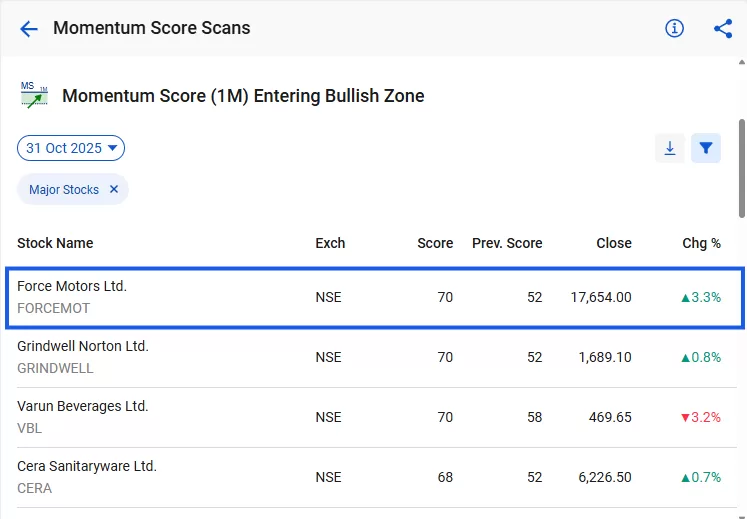
If you see, on 31st Oct 2025, Force Motors Ltd. has recently entered the bullish zone with its one-month momentum score rising to 70 from the previous level of 52. This reflects strengthening price action and growing investor interest.
Now, let’s look at the chart

When we look at the chart, the trend is clearly moving in an upward direction, validating the momentum score signal. So, you can use this stock screener to identify stocks with a high momentum score.
Now that you understand how the Momentum Score can help identify strong trending stocks, let’s take it a step further. Let’s know how to use other technical indicators using technical scans. Generally, technical indicators can be divided into the following categories:
- Trend Indicators
- Momentum Indicators
- Volume Indicators
- Volatility Indicators
Let’s explore each of these in detail and understand how StockEdge Scans are classified within these categories.
Trend Indicators
Trend traders profit by following market direction, entering long in upward trends and short in downward trends. No indicator guarantees success; disciplined risk management and strong psychology are essential. Let’s see how StockEdge scans assist.
Moving Averages
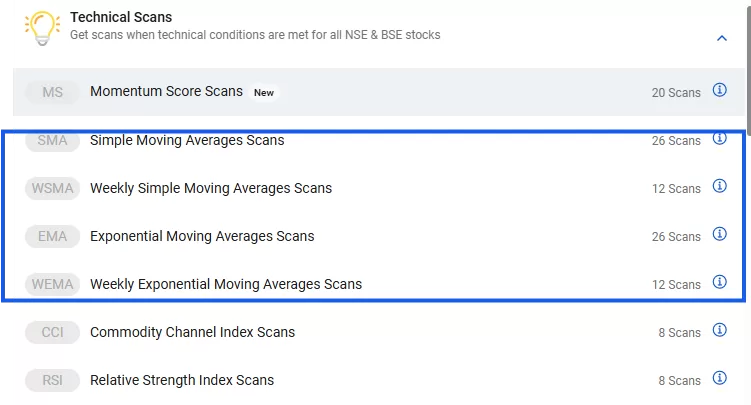
A Moving Average (MA) is a popular trading indicator that helps traders to identify trends without short-term noise. It acts as dynamic support and resistance. StockEdge offers four Moving Average scans for faster, cleaner trend analysis:
- Simple Moving Averages Scans
- Weekly Simple Moving Averages Scans
- Exponential Moving Averages Scans
- Weekly Exponential Moving Averages Scans
SuperTrend
The SuperTrend indicator is a popular trend-following tool that helps traders follow trends confidently and avoid market noise. When the SuperTrend is below the price, the trend is bullish, and when the SuperTrend is above the price, the trend is bearish.
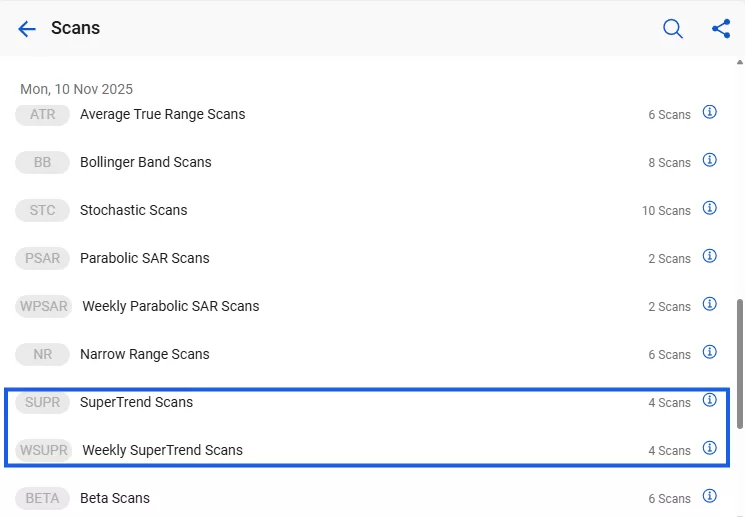
It is used in intraday, swing trading, and short-term setups. In StockEdge, you get two scans under this indicator category.
- SuperTrend Scans
- Weekly SuperTrend Scans
Parabolic SAR
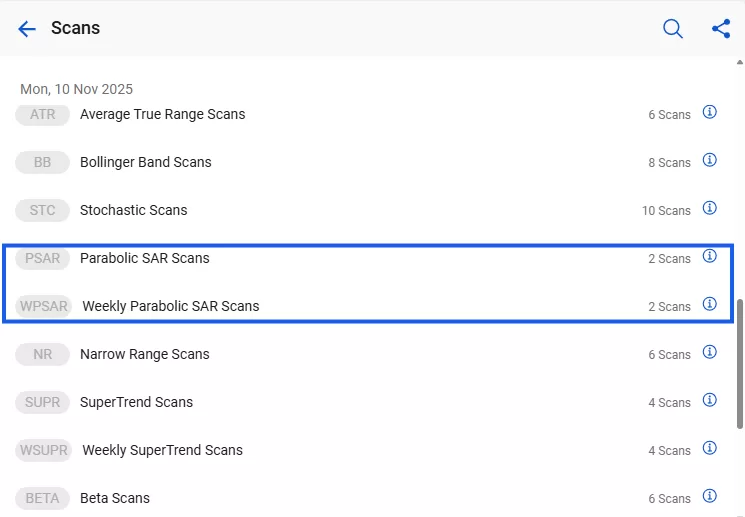
The Parabolic SAR is a trend-following indicator that signals potential reversals with dots above or below the price, aiding trend detection and stop-loss placement. StockEdge offers two scans under Parabolic SAR to help traders using trailing-stop strategies, as dots move closer to the price when momentum increases.
- Parabolic SAR Scans
- Weekly Parabolic SAR Scans
Momentum Indicators
Momentum traders profit by capturing the strength or weakness of price movements, focusing on speed rather than direction. They trade when momentum rises and exit when it slows, aiming to identify acceleration, overbought/oversold zones, and reversal points. Now, let’s check out how the StockEdge scans help.
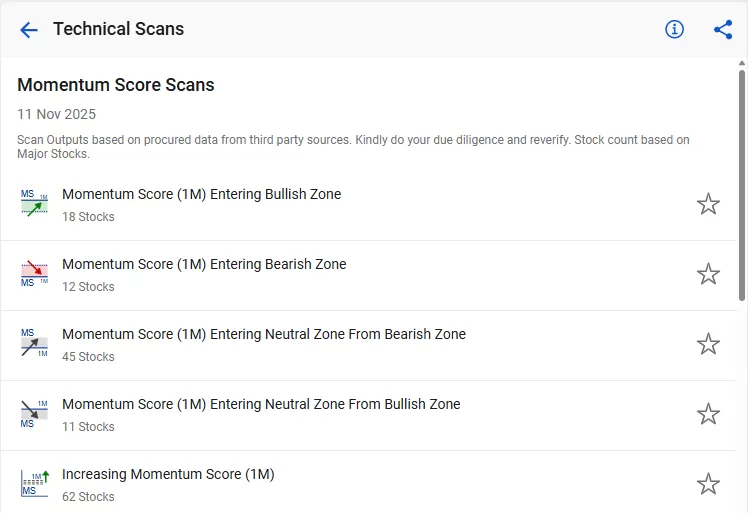
Momentum Score Scans
Momentum Score Scans analyze stock price strength over 1, 3, and 6 months to identify if a stock is bullish, neutral, or bearish, helping traders spot entry, exit, or hold opportunities.
Relative Strength Index (RSI)
RSI measures recent price movement speed to identify overbought and oversold conditions, helping traders spot early momentum shifts and strength buildup. Under StockEdge, you get two helpful RSI scans:
- Relative Strength Index Scans
- Weekly Relative Strength Index Scans
Commodity Channel Index (CCI)
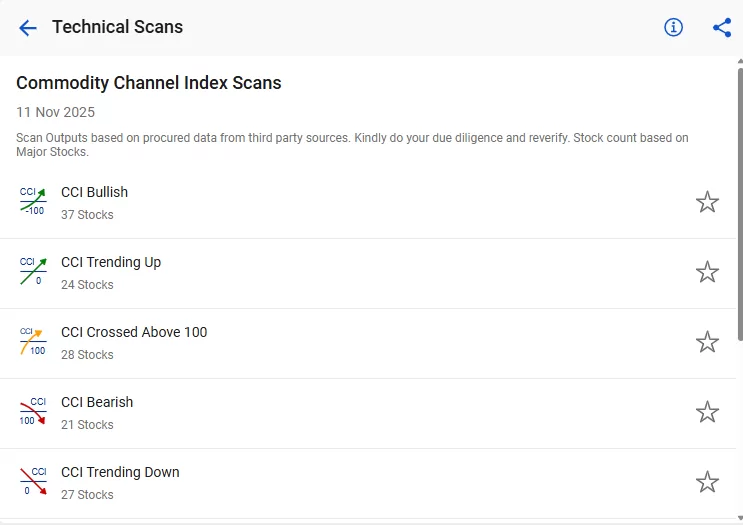
CCI measures price distance from mean to identify momentum shifts. StockEdge offers Commodity Channel Index Scans for reversals and trend turns. The CCI oscillates between +100 and -100 over the last 20 trading days.
William %R
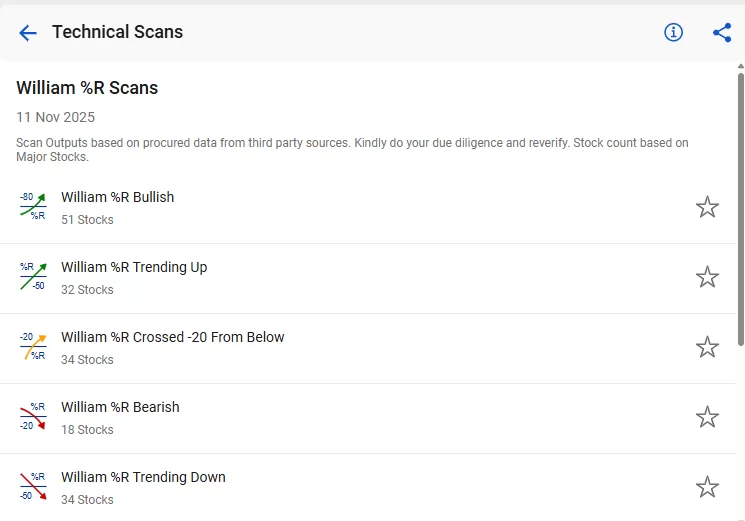
William %R identifies short-term momentum extremes by comparing the close with the recent range. StockEdge Scan offers William %R Scans showing trading strength; quick moves suggest overbought or oversold conditions, possibly signaling reversals.
Rate of Change (ROC)
The Rate of Change (ROC) measures the percentage change in price between the current and past periods. In StockEdge, two ROC scans are available to filter stocks: ROC Trending Up indicates an uptrend, and ROC Trending Down indicates a downtrend.

Stochastic Oscillator
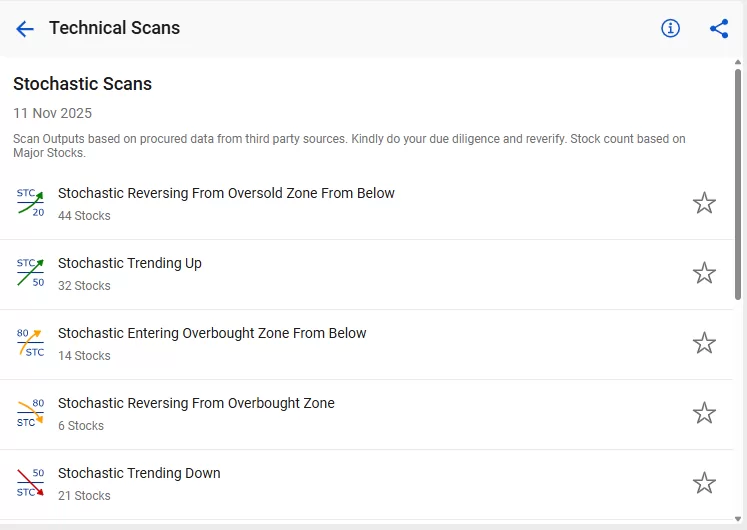
The Stochastic indicator compares a security’s closing prices over a period. Readings above 80 indicate overbought conditions, while those below 20 suggest oversold conditions. StockEdge provides various stochastic criteria to scan and filter stocks.
Volume Indicators
Volume traders aim to profit by understanding the strength behind price movements. They focus on whether institutional buyers or sellers are actively participating in the stock. High volume often validates trends, breakouts, and reversals, while low volume suggests weak participation.
The objective is to confirm the credibility of price action and avoid false breakouts. Volume indicators help spot accumulation, distribution, and money flow patterns. However, volume readings alone do not guarantee accuracy. Combining volume with trend and momentum indicators improves decision-making.
Now, let’s check out how the StockEdge scans help.
Money Flow Index (MFI)
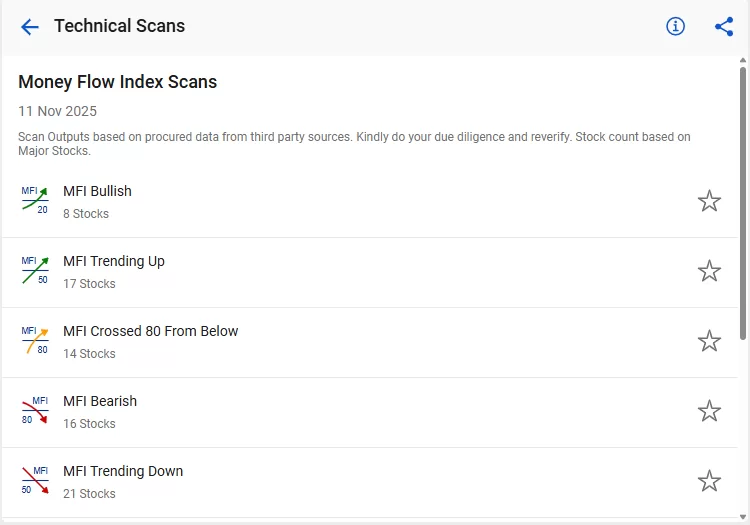
MFI, combining price and volume, shows money flow into or out of stocks, aiding in detecting accumulation and distribution. As a 0-100 oscillator over 14 days, it reveals money flow trends. Divergences, like a new high in price but a lower MFI high, can indicate a weak rally that may reverse.
Volatility Indicators
Volatility traders aim to profit by understanding how much and how fast price is expected to move. Volatility indicators help identify tight consolidations, expansion phases, and breakout opportunities. They also help traders manage risk by assessing how wide stop-losses should be.
The objective is to recognize contraction before expansion and prepare for potential sharp moves. While volatility indicators signal opportunities, they do not guarantee direction or profitability. Proper risk management and position sizing remain essential.
Now, let’s check out how the StockEdge scans help.
Bollinger Bands
Bollinger Bands help traders assess volatility. A squeeze shows low volatility, often leading to breakouts. StockEdge Scan provides Bollinger Band scans, where a stock’s price is between an upper and lower band plus a 20-day simple moving average. Since standard deviation measures volatility, bands widen during high volatility and contract during low volatility.
Average True Range (ATR)
ATR measures average price range, helping traders assess volatility, position sizing, and stop-loss placement. StockEdge Scan offers Average True Range Scans, a volatility indicator showing interest in a move. Strong moves often have large True Ranges, especially at the start; small movements have narrow ranges.

Narrow Range Patterns
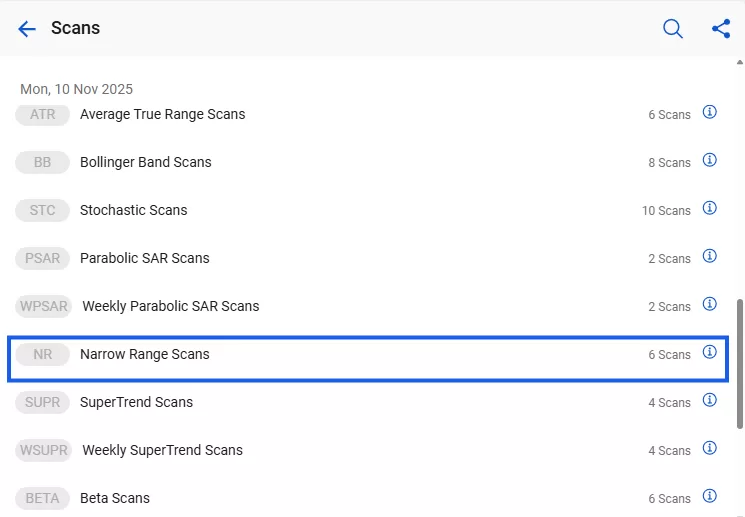
Narrow Range (NR4/NR7) patterns signal low-volatility sessions with price compression, often indicating an upcoming breakout. StockEdge Scans provide Narrow Range Scans, a breakout method assuming security prices trend up or down after brief consolidation. The pattern tracks volatility contraction, usually followed by expansion.
Bottom Line
StockEdge Technical Scans are designed to help traders analyze more quickly, make smarter trades, and stay consistent in their strategies. Whether you’re just starting out or you’re an experienced trader, these scans make it easier to discover actionable opportunities that match your approach, all without the need to spend hours searching through charts.
Read Also:How to Find Undervalued Stocks Using StockEdge Screeners
Frequently Asked Questions (FAQs)
1. How can I get started with StockEdge’s technical stock screeners?
Download the StockEdge app or visit the website → Go to Scans → Select Technical Scans → Choose any scan to view matching stocks and charts.
2. Are StockEdge technical scans free to use?
Some features are free, but more advanced and premium scans are available under StockEdge Premium.
3. Do I need to be an experienced trader to use the technical scans of StockEdge?
You have knowledge about the technical indicators. Technical scans are beginner-friendly. They simplify complex chart analysis by giving pre-built filters, so even new traders can easily understand market setups.
4. Can I create my own custom technical scans in StockEdge?
Yes. StockEdge Premium lets users create Custom Scans by combining indicators, price patterns, and conditions aligned with their trading strategy.
5. What’s the difference between fundamental and technical scans?
Fundamental scans filter stocks based on financial performance (revenue growth, earnings, valuations, etc.), whereas technical scans filter stocks based on price action, market trends, and indicators.


