Table of Contents
In the stock market, terminologies like ROE and ROCE are often used to analyze a stock’s financial performance. Both are return ratios as the name suggests which measures the profitability as well as the efficiency of the company’s financial performance.
In today’s blog, an explanation of ROE and ROCE will be provided for understanding the importance of analyzing these return ratios while making an investment decision.
Before we dive deep into the differences between these two ratios, let’s get the concept of ROE and ROCE in a simple and easy method.
Concept
Return on Equity (ROE)
The formula used to calculate return on equity is net income divided by shareholders’ equity.
To explain the logic behind the formula, let’s take an analogy. Imagine you and your friends start a lemonade stand in a hot summer. Each of you contributes some money to buy the ingredients and set up the stand. The money you contribute is like shareholders’ equity in a company.
Now, over the summer, your lemonade stand sells a lot of lemonade, and you make a profit. The profit you make is like the profit a company earns from its operations.
Return on Equity (ROE) is like looking at how much profit your lemonade stand is making compared to the money you and your friends put in to start it.
For example, if you and your friends invest ₹100 in total to start the lemonade stand, and by the end of the summer, you make ₹20 in profit, then your ROE would be 20%.
Return on Capital Employed (ROCE)
The formula to calculate ROCE is slightly different from ROE. Here, the capital for the business not only has shareholders’ equity but also borrowed capital, which is simple debt for the business. So, while we are considering both Equity and Debt as our capital, we will not consider the net income. Rather, we will take the operating profit, including any interest payment or taxes. Hence, the formula is:
ROCE= Earning Before Interest and Taxes (EBIT) / Capital Employed, where capital employed is basically the shareholders’s equity and total debt.
Imagine you and your friends start a lemonade stand but only this time you have borrowed ₹100 extra from your parents with a promise that you will pay ₹10 as interest on your loan.
End of the summer, the operating profit (EBIT) is ₹60 on a capital employed of ₹200. The ROCE would be 30%.
It seems taking leverage does have some extra advantage.
But which ratio should you consider to be more important while making investment analysis. To find out, you need to understand some more basic differences between ROE and ROCE.
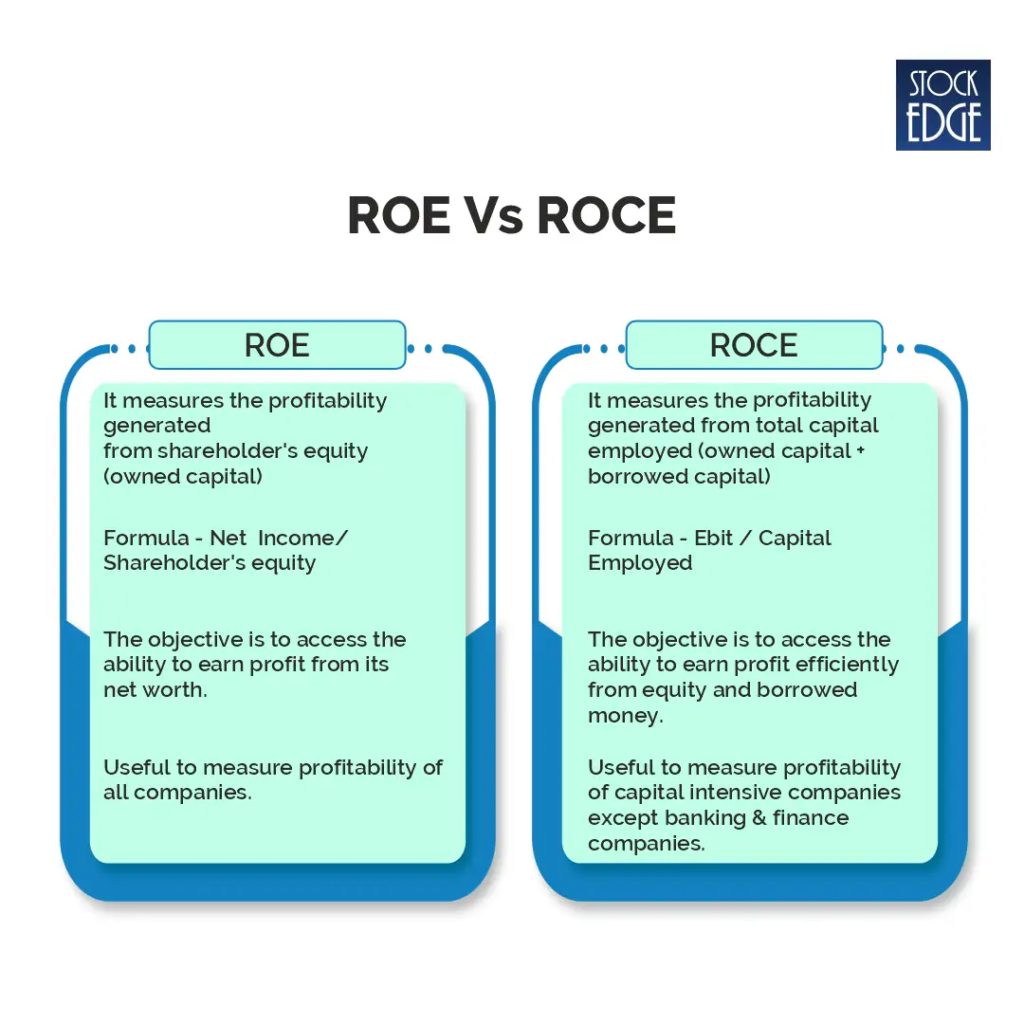
As you can see, the differences between ROE and ROCE do not seem much. However, when analyzing a company, it hugely varies among companies from different industries.
Analysis of ROE and ROCE
Both ROE and ROCE are important in analyzing a company’s profitability in two different scenarios. Let’s analyze two companies from the same industry with more or less the same market cap.
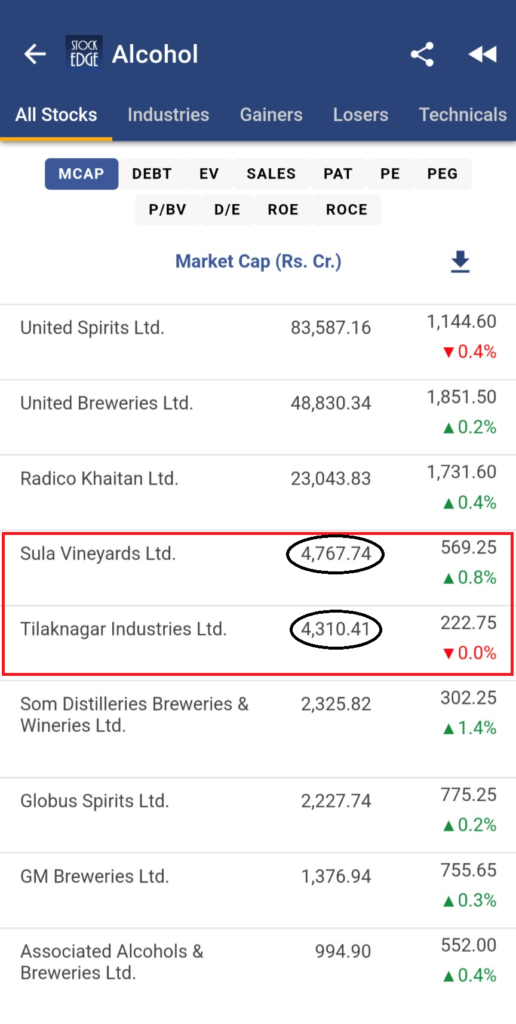
In the above screenshot, you see the list of alcoholic beverages stocks in the market. Out of which Sula Vineyards Ltd. and Tilaknagar Industries Ltd. are more or less having the same market capitalization.
However, if we compare the ROE and ROCE of the two stocks, there seems to be quite a difference in their financial performance.
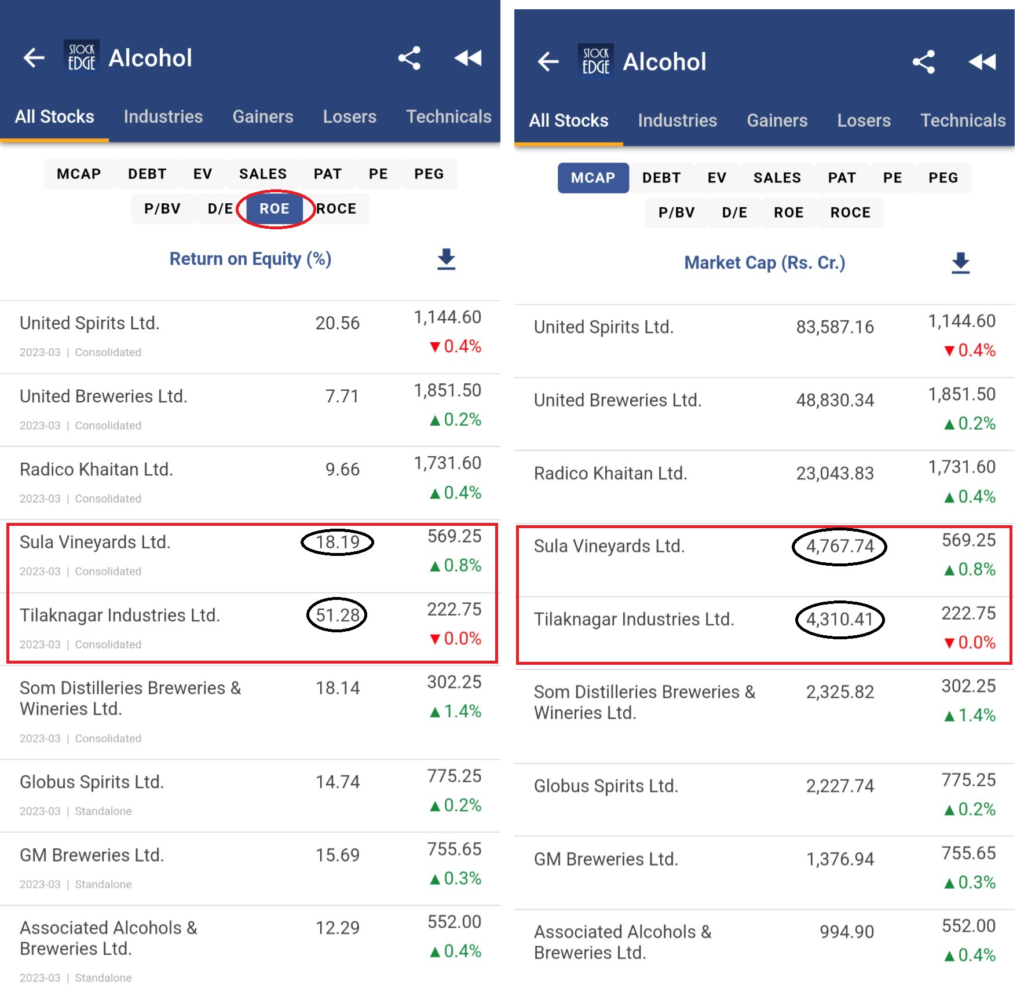
While doing a peer comparison of the two stocks, you can see that the ROE of Tilaknagar Industries Ltd. is substantially higher than Sula Vineyards Ltd, which means Tilaknagar Industries has been able to generate higher returns for its shareholders on its net worth.
On the other hand, taking the total capital employed, including debt, the return ratio (ROCE) for Tilaknagar Industries Ltd. is slightly better than that of Sula Vineyards Ltd.
So, the peer comparison between these two companies suggests that Tilaknagar Industries Ltd. has generated higher ROE and ROCE than Sula Vineyards Ltd.
Why is high ROE better?
A higher ROE in a company from its peers means that the company is effectively generating profits for its shareholders. To identify stocks with high ROE, you can use StockEdge Scans. A high ROE indicates that the company has been able to generate a return from its core capital without debt.
Is ROCE a better financial metric?
Yes, only if the company is more capital-intensive and has debt involved in its balance sheet. ROCE is an important financial metric to analyze a company’s ability to generate profit by employing its total capital (both equity and debt)
However, if the company is debt-free, then ROE and ROCE will more or less be the same as there is no debt involved; the company’s capital is only its shareholder’s equity.
It is important to understand that taking leverage is not entirely bad for companies. But, if a company can efficiently manage its entire capital including its both equity and debt to improve profitability then such stocks must be kept under a close watch for probable investment. To identify stocks with improved ROCE, you can use StockEdge.
Combining ROE and ROCE
As we have discussed earlier, identifying stocks with high ROC or companies that are improving their ROCE can be done with ease with StockEdge Scans. But identifying stocks for an investment requires a lot more study of company fundamentals.
Therefore, what if we combine the power of ROE and ROCE metrics along with a few more additional criteria to get the ultimate list of stocks that may turn out to be a good investment opportunity in the long run.
Let’s create a few more additional scans to filter out strong stock for your portfolio. We will create a Combo Scans in StockEdge app.
To showcase the power of Combo scans we have included two major return ratios ROE and ROCE along with a few more fundamental scans and a price action scan to name it as Financial Improvement with Price action (FIPA).
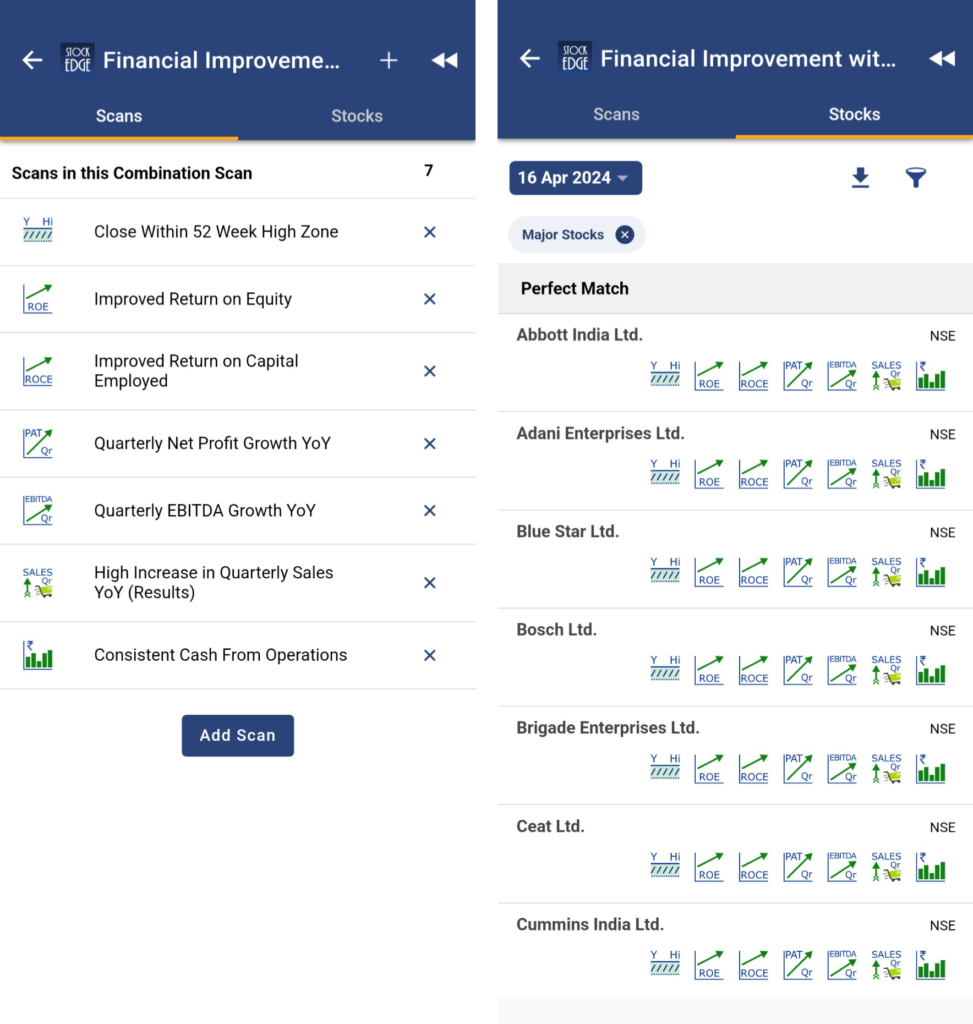
Using StockEdge Combo Scans, 7 Scans are added under FIPA, which are:
- Improved Return on Equity
- Improved Return on Capital Employed
- Quarterly net profit growth YoY
- Quarterly EBITDA growth YoY
- High Increase in Quarterly sales YoY
- Consistent Cash flow from operations
- Close within 52 Week High Zone
The list of stocks which have fulfilled all the criteria. You can even download the list to excel for further analysis or filter from the basket of stocks like the Nifty 50, Nifty 200 or only F&O stocks.
So, with the help of Combo scans, you can develop your own set of scans to identify strong stocks in the stock market.
Read this blog if you would like to learn more about StockEdge’s combo scan feature.
Coming back to ROE and ROCE which are powerful financial metrics to analyze a company’s fundamentals. At the end both return ratios have their own importance.
The Bottom Line
We can come to the conclusion that both ROE and ROCE are important financial metrics for analyzing a company’s financial performance based on its profitability. Moreover, each return ratio has its own set of importance. The objective is to use the correct return ratio for the right set of companies. Additionally, analyzing the return ratios is the only way to judge a company’s financial performance. There are other metrics that are important to analyze before making an investment decision.
To identify fundamentally strong stocks in the market, use StockEdge Scans to filter out stocks. Read the blog Optimize Your Stock Selection: Leverage StockEdge Scans to learn more about it.
Happy Investing!


