Key Takeaways
- Long Unwinding: It refers to traders selling off long (buy) positions that they had earlier taken often to book profits or cut losses as sentiment turns cautious or bearish.
- Market Signals: Long unwinding is confirmed when stock prices fall and open interest in futures contracts also declines suggesting long positions are being closed.
- Emotional Impact: This move typically reflects a shift from bullish optimism to uncertainty or negativity, making long unwinding a generally bearish sign.
- How to Spot It: Look for rising sell volume along with shrinking open interest; a falling price with those signs usually points to long unwinding-related profit booking.
- Investor Use Case: Recognising long unwinding helps traders identify short-term pressure or profit-taking trends but context matters, as it could be part of consolidation or welcome correction before recovery.
Table of Contents
The stock market operates through a mix of buying and selling activities that influence asset prices. One such trading action is long unwinding, a term that describes investors selling off their long positions. This often happens when traders believe that prices might decline in the future, either due to market trends, economic data, or other influencing factors.For traders looking to refine their strategies and execute trades efficiently, platforms like Exness Go provide seamless trading experiences with real-time market insights.
Long unwinding is a significant market indicator that often signals a shift in sentiment from bullish to bearish. When institutional and retail traders exit their long positions in large numbers, it can lead to downward pressure on stock prices. Understanding long unwinding can help traders and investors guide market movements, make informed decisions, and minimize risks.
One key distinction to understand is the difference between long unwinding and short covering. While long unwinding occurs when traders close their existing long positions, short covering means that traders who previously sold stocks or derivatives short are now buying them back to close their positions. Both phenomena impact market trends, but they arise from opposite trading strategies. In this article, we will explore long unwinding in detail, including its patterns, differences from short covering, and expert insights. We will also discuss how traders can identify long unwinding trends to adjust their trading strategies accordingly.
What is long unwinding in trading?
In trading, long unwinding means the process where investors sell off their existing long positions in securities, such as long build up stocks or futures contracts. This action is typically taken when they anticipate a potential decline in the asset’s price or when they decide to secure profits from previous gains. The term “long” denotes buying an asset with the expectation that its value will rise, while “unwinding” signifies the closing out or selling of that position.
Understanding Long Unwinding
When an investor holds a long position, they have purchased a security believing its price will increase over time. Long unwinding occurs when the same investor decides to sell this security, either to realize profits or to prevent potential losses if they foresee a downturn. This behavior can be influenced by various factors, including changes in market sentiment, economic indicators, or company-specific news. Similar trends can be observed in the commodities market, where traders use a platform for gold trading to track price movements and optimize their exit strategies from long positions. Since gold is often considered a safe-haven asset, long positions in gold can be unwound in response to macroeconomic factors and shifts in global financial conditions.
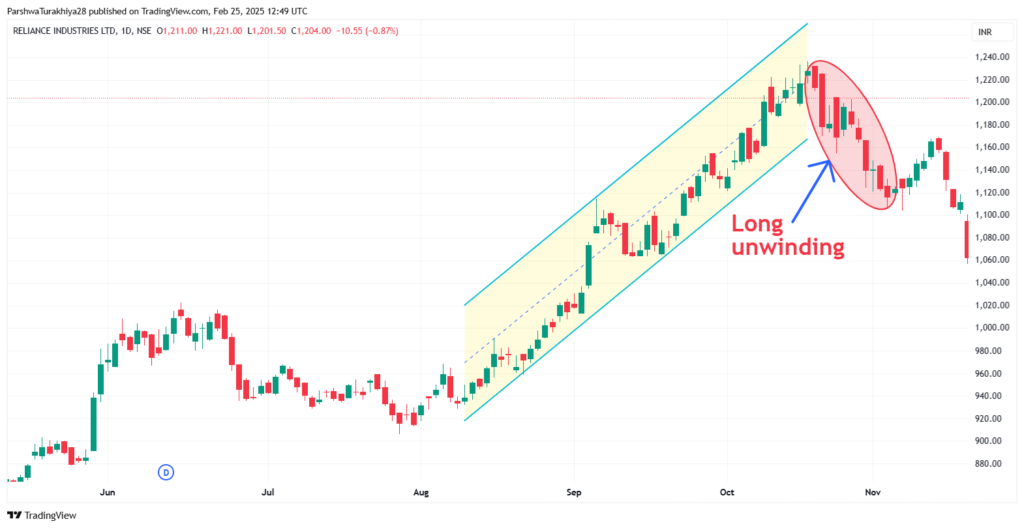
The provided chart illustrates long unwinding in Reliance Industries Ltd. (NSE) on a daily timeframe. Here’s a detailed breakdown of how long unwinding is occurring based on the price action:
1. Uptrend Prior to Long Unwinding
- The stock was in a strong uptrend, as indicated by the ascending channel (highlighted in yellow).
- Buyers were actively accumulating positions, leading to higher highs and higher lows.
- The price moved within the parallel trendlines, confirming a structured rally.
2. Long Unwinding Phase (Highlighted in Red)
- Long unwinding is visible when the stock breaks the channel support and begins declining.
- The red candlesticks show continuous selling pressure as investors begin to exit their long positions.
- This selling is likely due to profit booking after an extended rally.
3. Confirmation of Long Unwinding
- A breakdown from the uptrend channel suggests that traders are closing their long positions.
- The volume (not visible in this chart but usually a factor) likely increased during the selling phase, further confirming the unwinding process.
- The downward move becomes sharper as more traders exit their positions.
4. Impact of Long Unwinding
- The stock price loses momentum and enters a correction phase.
- Selling pressure increases, leading to lower highs and lower lows.
- If no strong support holds, it could trigger further declines or even a trend reversal.
When does long unwinding occur?
Long unwinding usually happens in specific scenarios:
Bearish market trends
When the broader market shows signs of decline, traders often unwind their long positions to reduce potential losses. A downtrend in major indices or sectors can trigger widespread selling, forcing investors to reassess their strategies.
Profit booking
After a strong price rally, many investors choose to secure their gains by selling off their holdings. This profit booking can lead to long unwinding, as traders exit positions to lock in returns before any potential reversal.
Change in fundamentals
Negative news related to a company, industry, or the overall economy can prompt traders to sell. Poor earnings, regulatory issues, or economic downturns often weaken investor confidence, leading to long unwinding.
Technical indicators
When a stock reaches a key resistance level or shows reversal signals, traders might start exiting their positions. Technical patterns like bearish divergences or overbought conditions often indicate a potential downturn, prompting unwinding.
Understanding these factors can help traders anticipate market moves and adjust their positions proactively.
Identifying long unwinding patterns
Recognizing long unwinding patterns in the market is crucial for traders. Here are the key indicators that can help identify long unwinding:
1. Declining open interest
In the derivatives market, open interest represents the total number of outstanding contracts. A decline in open interest, along with a price drop, indicates that traders are closing their long positions, which is a sign of long unwinding.
2. Increase in selling volume
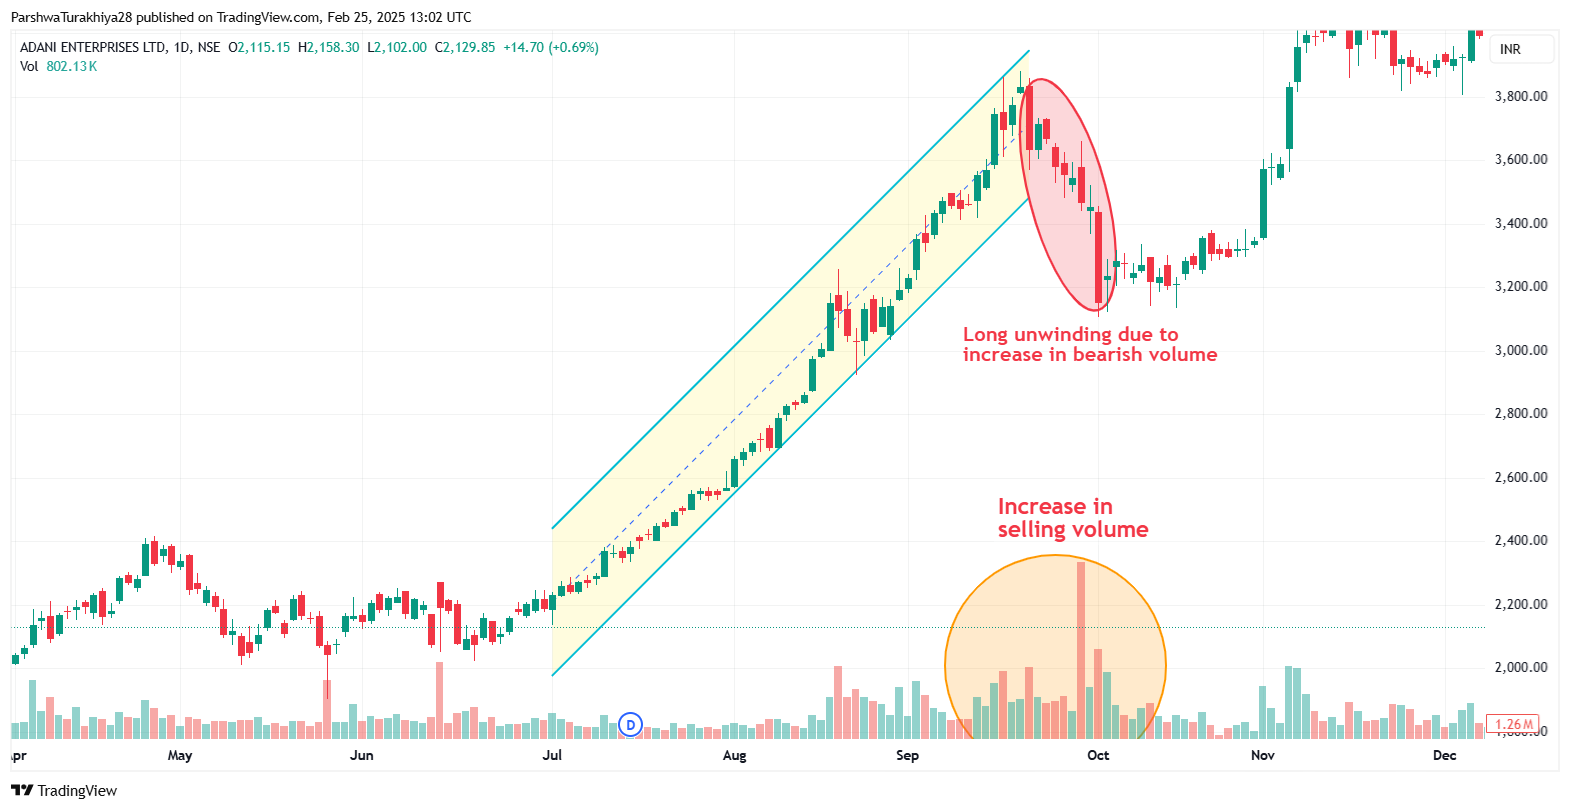
If there is a sudden rise in selling activity, particularly in a stock or futures contract that has been in an uptrend, it may suggest long unwinding. A spike in sell orders after a prolonged bullish trend is a common indicator.
3. Price reversal with high selling pressure
When a stock’s price starts declining after reaching a peak, accompanied by higher trading volumes, it signals long unwinding. If this pattern appears consistently across multiple sessions, it strengthens the likelihood of long unwinding.
4. Breakdown from support levels
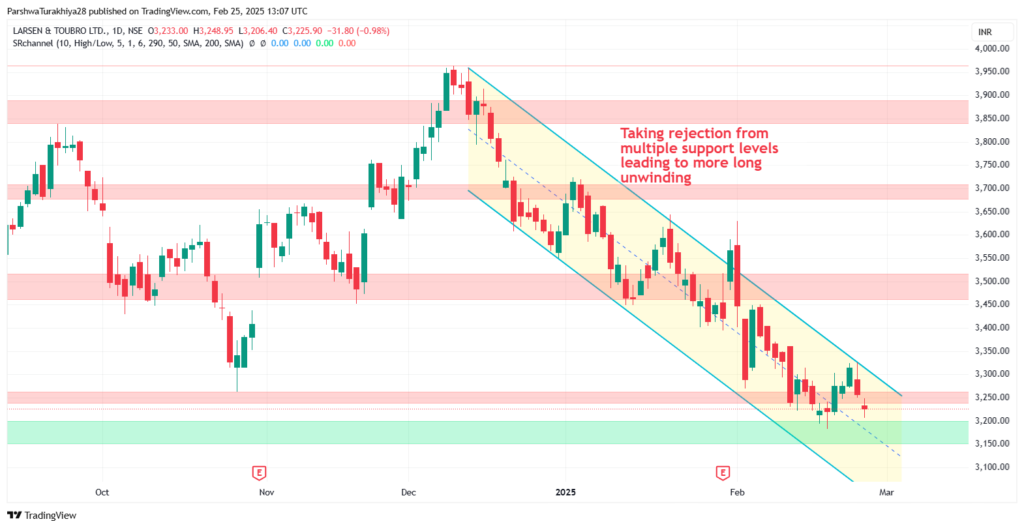
Stocks have key support levels that act as price floors. If a stock breaks below its support level with strong selling pressure, it can be a sign that traders are unwinding their long positions.
5. Bearish Candlestick patterns
Technical traders use candlestick patterns to spot long unwinding. Some bearish patterns indicating long unwinding include:
- Shooting star. A candle with a long upper wick and a small body at the top of an uptrend.
- Bearish engulfing. A large red candle that completely engulfs the previous green candle.
- Hanging man. A small body with a long lower wick, indicating selling pressure.
Long unwinding vs. short covering: Key differences
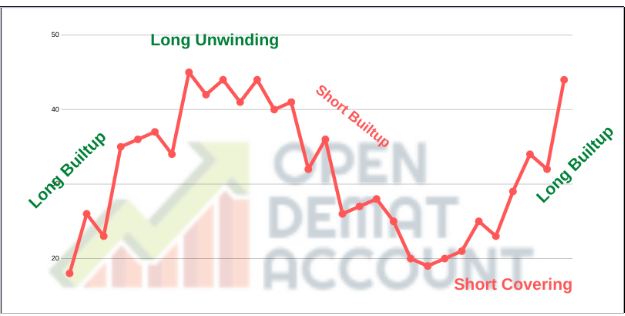
Here are the key differences between both:
Understanding short covering
While long unwinding refers to selling long positions, short covering involves buying back shares that were previously sold short. Short covering occurs when traders who borrowed and sold shares at a higher price repurchase them at a lower price to close their positions.
Key differences between long unwinding and short covering
| Aspect | Long Unwinding | Short Covering |
| Action Taken | Selling long positions | Buying back short positions |
| Market Sentiment | Bearish | Bullish |
| Effect on Price | This leads to a price decline | Leads to the price increase |
| Trader Behavior | Exiting profitable trades or cutting losses | Closing short trades to avoid losses |
Traders must differentiate between these concepts to interpret market trends accurately. While long unwinding often suggests bearish sentiment, short covering can lead to short-term price spikes.
What expert say about long unwinding
Based on the insights of analyst Anton Kharitonov, long unwinding serves as a critical early indicator of potential market corrections. When institutional investors begin to reduce their long positions, it often signifies a shift in sentiment that may lead to broader market declines. Retail traders and smaller investors should closely monitor these movements, as they frequently precede heightened volatility in the financial markets.
To effectively navigate long unwinding, implementing stop-loss orders is essential. Setting predefined exit points allows traders to protect their capital from sudden market downturns. Additionally, tracking key technical indicators such as moving averages, RSI, and MACD can help identify emerging trends and provide insights into when long unwinding might intensify.
Diversification remains one of the most effective strategies to mitigate the risks associated with long unwinding. Rather than concentrating investments in a single stock or sector, spreading risk across multiple asset classes helps cushion potential losses. A well-balanced portfolio ensures that declines in one segment can be offset by gains in another, fostering stability during periods of market uncertainty.
Conclusion
Long unwinding is a crucial concept in trading, reflecting shifts in investor sentiment and market trends. Understanding its meaning, identifying key indicators, and differentiating it from short covering can help traders make better investment decisions.
For traders looking to refine their strategies, recognizing long unwinding patterns can provide valuable insights. By staying informed and using technical analysis, traders can mitigate risks and seize market opportunities.
FAQs
What is long unwinding in the stock market?
Long unwinding occurs when traders or investors sell off their existing long positions in stocks or derivatives. This typically happens due to profit booking, negative sentiment, or market uncertainty, leading to downward pressure on prices.
How does long unwinding differ from short covering?
Long unwinding involves selling existing long positions, whereas short covering is when traders who previously sold stocks short buy them back to close their positions. Both impact market movements, but they arise from opposite trading strategies.
What are the key indicators that signal long unwinding is occurring?
Long unwinding is often identified by declining prices accompanied by falling open interest and trading volume. Technical indicators like RSI (Relative Strength Index) moving downward and price rejection near resistance levels can also signal unwinding.
Why do institutional investors engage in long unwinding?
Institutional investors may unwind their positions due to macroeconomic concerns, sector rotation strategies, or shifting market sentiment. They often book profits when stocks reach predetermined targets or show signs of weakening momentum.


