Table of Contents
Let’s begin this blog with a question. Does it really make sense to make investment in gold now? C’mon! it’s possibly the oldest investment that was known to humans. How much can it anyways rise. It’s just going to be there, stored in your almirah or bank lockers and would not provide you any interest or dividend, right? Well, if you also think this, then you’re at the wrong place, as this blog might change your mind.
Gold, although a traditional safe-haven asset, can be a great inflation hedge due to its limited quantity available world over. The scarcity therefore makes it a good store of money, better than the modern currency. Also, if you notice over the long term, gold has seldom given negative returns plus shows low volatility.
By moving a step further into portfolio allocation, gold might prove to be an excellent risk diversifier for your equity portfolio. By investing in gold, you are able to position your portfolio for various unforeseen events, such as COVID-19, the world war, etc. Look at the chart below.
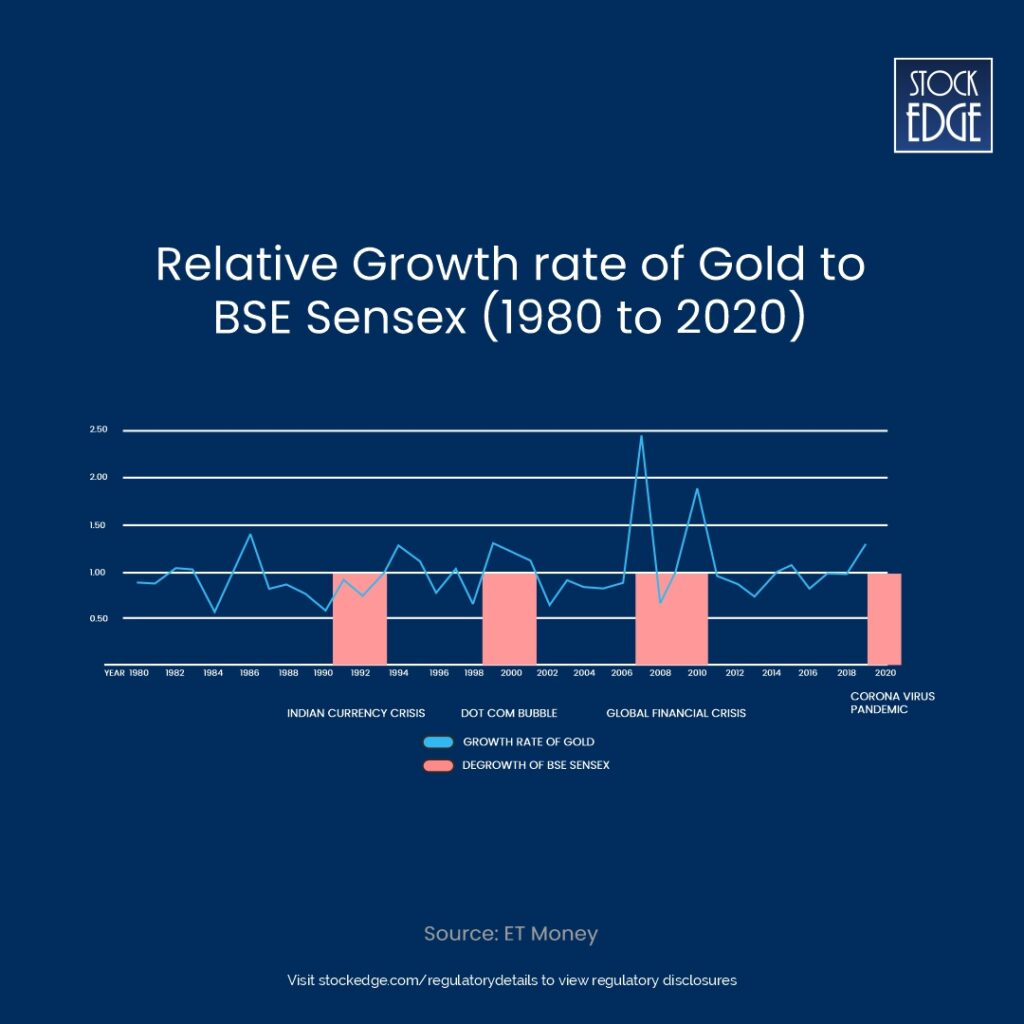
The chart shows that whenever there was a fall in Sensex due to a financial, currency or global crisis, gold has risen and for those who invest in gold, were saved from the downfall in their equity portfolios to a certain extent.
Why is Gold Precious?
Have you ever wondered why gold is so precious? Apart from the religious and emotional sentiments that we, Indians, associate with gold, its scarcity also has a role to play. There are just 190,000 metric tonnes of gold in the world reserve and mining gold is getting difficult day by day. Due to this limited availability, gold is considered a good inflation hedge.
Return on Investment in Gold
The return on investment in gold is derived from two aspects:
- Price of gold in the international market. The price of gold, being a commodity, is driven by the trading at the London Bullion Market (LBMA). The rates quoted at LBMA are used as a reference world over.
- USD/INR rate: As discussed, gold prices at LBMA are used globally as a reference. However, these rates are published in USD per ounce (Oz). For your understanding, one ounce = 28.35 gm (approximately). For a dollar rate of INR 85 per USD, the gold price of INR 66,000 per 10 gm at LBMA would be USD 2,201 per oz [(66,000 * 28.35/10)/85].
So, in layman’s terms, gold prices are quoted at INR per 10 gm in India and USD per oz in international markets.
Let us now look at why we should invest in gold.
Gold past returns as of 31 December 2023:
| 1 Year | 3 Year | 5 Year | 10 Year |
| 14.76% | 25.79% | 101.14% | 136.18% |
So, seeing the past returns, will you invest in gold?
Don’t make your decisions yet. Past returns are no guarantee of the future returns. Therefore now we shall discuss the factors that affect gold prices.
Factor Affecting Gold prices
Here are some of the factors affecting gold prices:
- Demand and Supply in the market
Gold prices are invariably decided by the demand and supply factors. Demand for gold in India generally increases during festive or wedding seasons and hence we see prices of gold making highs during that period.
- Exchange Rate
The USD INR rate is also a major factor in deciding gold prices. In the case of INR appreciation (say, from INR 85 per USD, it is reduced to INR 80 per USD), gold prices fall. While in case of INR depreciation (say, from INR 82 per USD, it increases to INR 87 per USD), gold prices rise. This is based on the assumption that international prices remain constant.
- Global Market Trends
Gold is considered a “safe haven”. This means that investors rush to buy gold when there is uncertainty in the market, such as COVID-19, war, etc. Also, gold is an inflation hedge. Hence, the price of gold increases if inflation increases the world over, as seen in the year 2023.
- Government regulations
Fiscal policies from time to time are used to influence the price of gold. Increase in taxes, import duty, permission to drill more mines, etc. are deterrent to the gold returns. Did you question here why permission to drill more gold mines was a deterrent to gold prices. Well, with more mining, supply of gold would increase, and Economics teaches us, higher the supply lower the PRICE!
- Technical Analysis
Gold price’s trend, like any other asset class can be predicted using technical analysis. The indicators and patterns used in stocks and indices, can interchangeably be used on gold price charts as well. StockEdge has a host of screens to analyse and predict gold prices to make a decision, whether to invest in gold!
How to Invest in Gold
Earlier, the investment in gold was limited to buying gold from the jeweller you trust. This may be in the form of jewellery (which attracts making charges, extra) or in the form of gold biscuits and Ginni (8gm gold coin).
However, with the increased hassles of storage of gold and the higher making costs, investors have started shifting to digital gold. Let’s understand the difference between physical and digital gold.
| Physical Gold | Digital Gold |
| Comes in the form of jewellery, bars, coins, etc. | Comes in digital form, stored in a digital wallet. |
| The purity of physical gold can be questioned. Generally, in jewellery form, its purity is lower than 90%. | Digital gold is 24K. |
| The pricing is generally higher than what is quoted on Multi Commodity Exchange (MCX) while buying. It is lower than the price quoted at MCX while selling. | The price will be similar to the MCX quotes for the day. |
| Making cost and GST are included in making physical gold purchases. | Only GST is charged. |
| Storage cost is high, as there is risk of theft. | No risk of theft and hence low storage cost. |
| Liquidation of investment in gold in physical format is difficult. Capital gain tax applicable. | Easy liquidation. Investment through mutual funds, gold ETFs, digital gold through fintech platforms, attract capital gain taxes. Investment in Sovereign Gold Bonds (SGB) do not attract capital gain tax if sold post 8 years maturity. |
How to Trade in Gold
Buying Gold Futures
Just like the BSE and NSE are stock exchanges, the Multi Commodity Exchange (MCX) and National Commodity and Derivative Exchange (NCDEX) are the commodity exchanges for India. In India, you can only trade gold through the futures market on the MCX. The gain or loss on the future prices of gold has to be settled at the MCX, just like a stock’s future expiry, on month’s end. No physical delivery is allowed for MCX. MCX trading is open from Monday to Friday, 9 AM to 11:30 PM.
How to Trade in Gold Futures?
The current options available in the futures market of MCX to invest in gold and their applicable margins are listed below:
| Ticker | Quantity (kg/gm) | Margin (INR per Lot) |
| GOLD | 1 Kg | 6,06,874 |
| GOLDGUINEA | 8 gm | 4,846 |
| GOLDM | 100 gm | 60,784 |
| GOLDPETAL | 1 gm | 596 |
By buying any of the above-mentioned gold investments, you may trade in gold. The contracts have a monthly expiry.
You can use both fundamental and technical analysis for predicting the price of gold. There are many analysts and research reports available on the internet, to give you perspective of the gold movements in the near future.
Ways to Invest in Gold for Long-Term
Various Instruments to Invest in Gold
| Gold ETF | Gold Mutual Fund | Sovereign Gold Bonds (SGB) |
| Gold Exchange Traded Fund (ETF) invests and purchases physical gold on behalf of investors and keeps it in a bank vault. ETF price tracks the market price of gold. | Gold MF invests in gold ETFs in order to provide investors with returns close to physical gold. | SGBs are issued by the Reserve Bank of India (RBI) in various trachea during a year with a maturity of 8 years. |
| These are traded in the secondary market just like shares. | These are to be purchased or sold through mutual fund platforms. | SGBs issued by RBI are subscribed through banks and stock brokers with a process similar to IPO. Already issued SGB tranches are traded in the stock exchanges just like shares. |
| Moderate liquidity. | Highly liquid. | Has lower liquidity than Gold ETF and Gold MF. |
| Charges include expense ratio and transaction charges. Lower than MF. | Charges include expense ratio and transaction changes. Higher than Gold ETF and SGBs. | No separate charges. Instead comes with an added advantage of 2.5% p.a. interest on the issue price payable semi-annually. |
| Demat account is required to invest in gold ETF. | No demat account required to invest in gold MF. | SGB can be availed in both physical certificate and demat accounts. |
Proxy Investing in Gold
How to Invest in Stocks that are Directly Related to Gold?
A company that derives revenues directly or indirectly through gold can be considered a proxy play to investment in gold. The basic screening process to judge the fundamentals of the company is to be carried out, with an additional layer of prediction of gold prices. The additional factor of gold price fluctuation, can make these stocks more volatile than the market (Sensex/ Nifty).
StockEdge provides a section of “investment themes” which categorises stocks as per the themes relevant to their sector. For gold, check out the investment theme section on “The Shining Metal-Gold”, for interesting stock ideas.
To know more on theme based investment in the stock market, read Thematic Investing: A Comprehensive Guide
Here are some of the top stocks to look at if you want to invest in gold through stocks.
Titan Company Ltd.
Titan is the flagship fashion and jewellery company of the Tata Group. The company owns and operates stores of Tanishq, Titan, Fast Track, Xylys, Helios and many more. Tanishq is the jewellery brand of the company and has been able to make a place in the un-organised jewellery market in India.
90% of Titan’s revenues are through the jewellery business, Tanishq. Tanishq has a market share of 7% of the overall jewellery business. Therefore, a lot of share price movements in Titan is influenced by gold prices.
Let’s look at the fundamentals of the company.
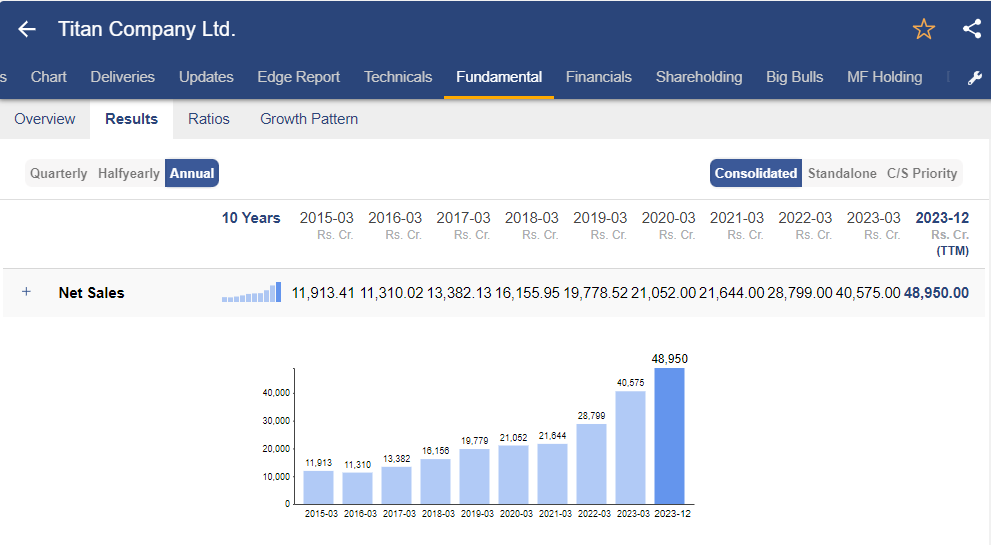
Sales Growth– Titan has been able to grow its sales at a CAGR of 26.44% p.a. over the last 5-years. Here is annual net sales growth of Titan Ltd. shown in the form of bar chart in StockEdge.
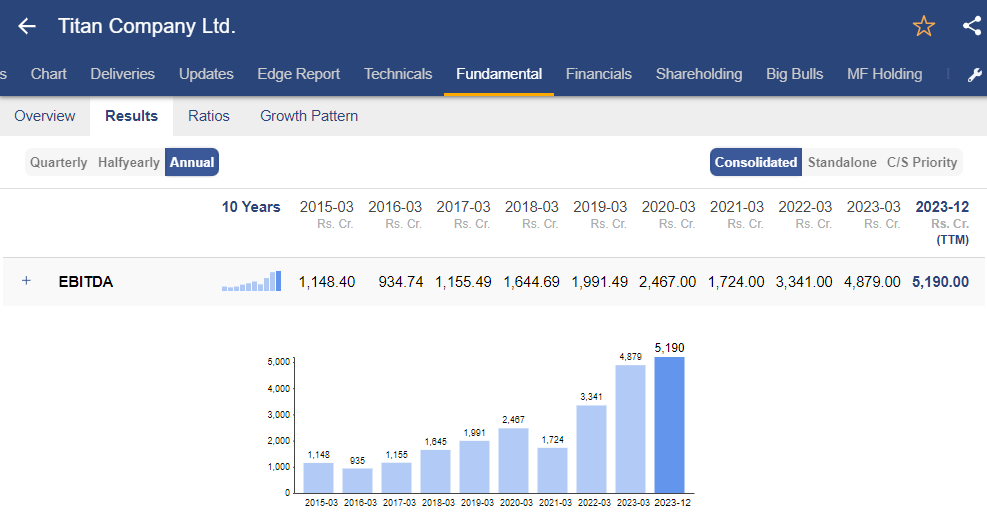
EBITDA Growth– The company grew its EBITDA by 24.29% p.a. CAGR over the last 5 years. Take a look at EBITDA growth of Titan Ltd.
Now, let’s dive into the financial ratios of Titan Ltd. Using StockEdge, you can easily do a ratio analysis of Titan Ltd.
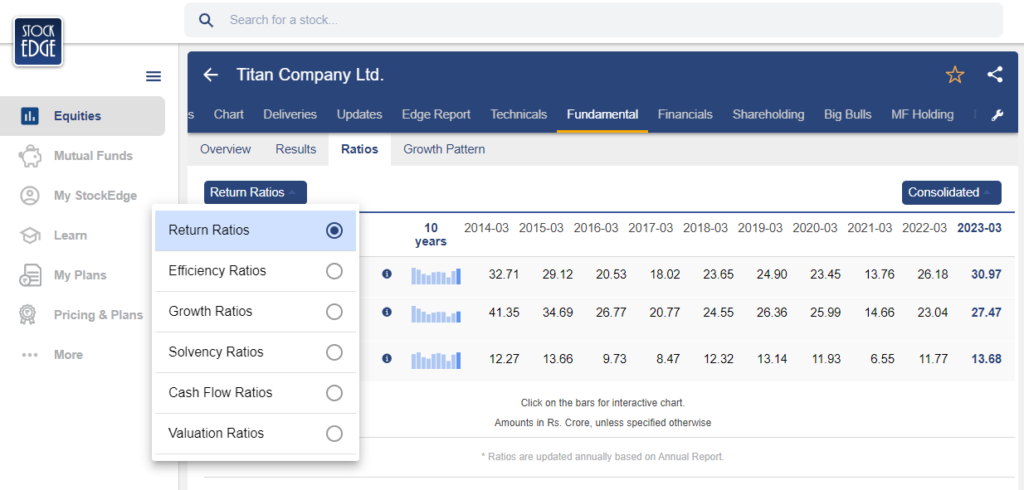
- Return on Equity (ROE) of Titan Ltd. – The ROE of the company stood at 30.97% for the year ending 31 March 2023 which is highest in the last 5 years.
- Debt– The company is debt-free.
- Valuation – The company trades at a PE ratio of 68.87x, higher than the last 5-year average
Muthoot Finance Ltd.
Muthoot is a dominant gold finance NBFC with a loan book of 82,773 crores and a gold loan book of 12,397 crores as of 31 December 2023. Since gold is mortgaged by borrowers, higher gold prices mean higher asset value for Muthoot. Therefore, gold prices are an important factor for Muthoot’s stock price movements.
Let’s look at its fundamentals.
Sales Growth– The company has been able to grow its net interest revenues by 12.13% p.a. CAGR over the last 5-years. Here is annual net sales growth of Muthoot Finance Ltd. shown in the form of bar chart in StockEdge.
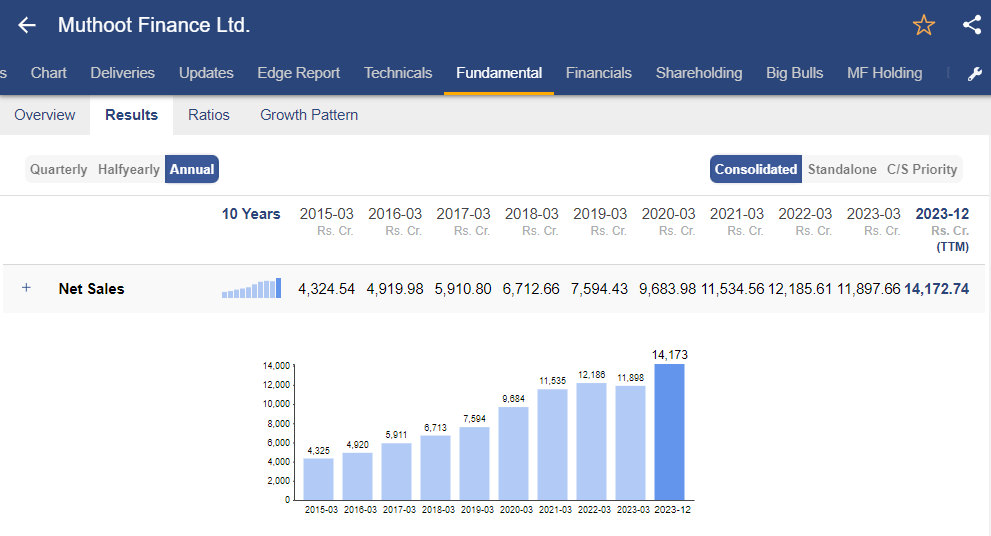
EBITDA Growth– The company has been able to grow the EBITDA by 12.57% p.a. CAGR for the last 5-years. Take a look at EBITDA growth of Muthoot Finance Ltd.
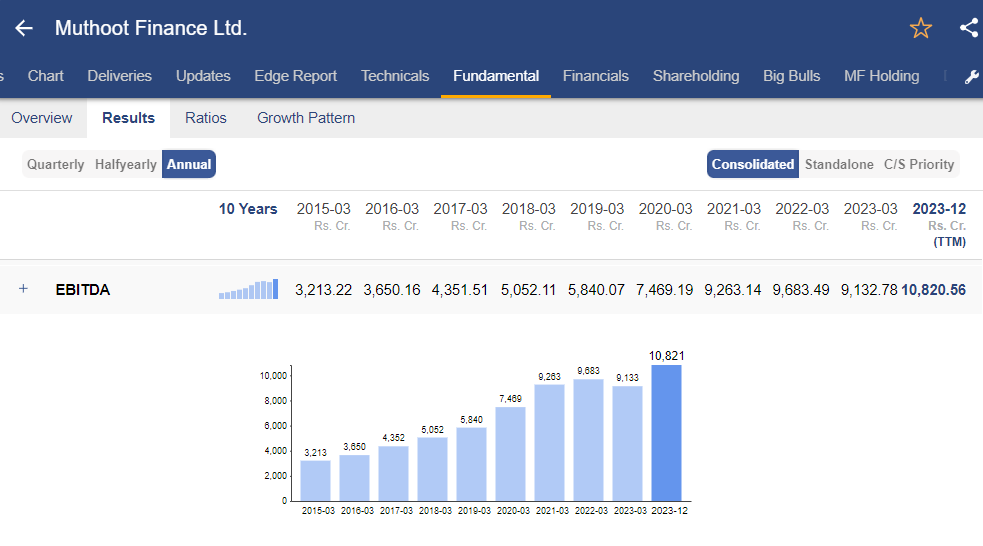
Now, let’s dive into the financial ratios of Muthoot Finance Ltd. Using StockEdge, you can easily do a ratio analysis of Muthoot Finance Ltd.
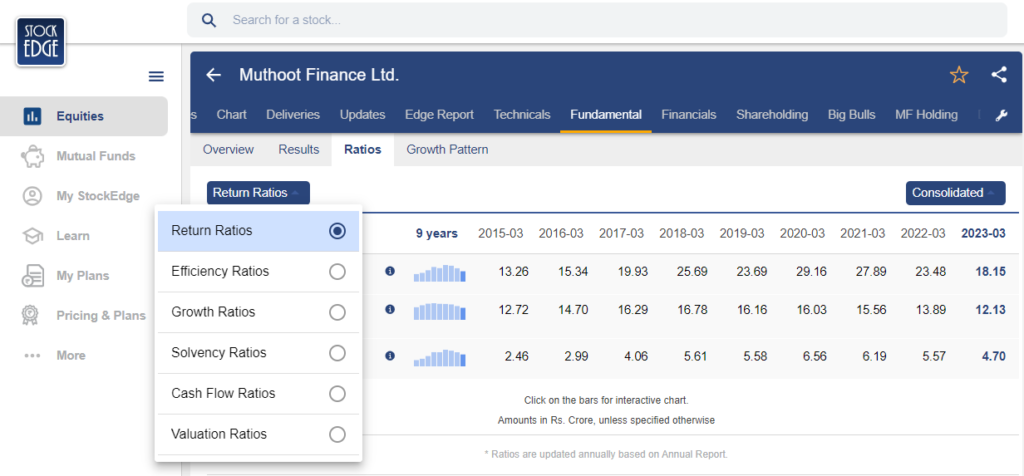
- Return on Equity (ROE) Muthoot Finance Ltd. – The company posted an ROE of 18.15% in 2023, lower than the 5-year average.
- Valuation – The company is trading at a PB of 1.81x, lower than the 5-year average.
Kalyan Jewellers India Ltd.
Kalyan Jewellers is a jewellery retailer from Kerala. In the past 30 years, the company has 201 showrooms in India and 34 showrooms in the Middle East. The company’s presence is across India.
Gold is a raw material for jewellers like Kalyan. Hence, fluctuations in gold prices have a direct impact on Kalyan’s stock prices.
Let’s look at the company’s fundamentals.
Sales Growth– The company has been able to grow its sales at 11.68% p.a. CAGR over the last 3-years. Here is annual net sales growth of Kalyan Jewellers Ltd. shown in the form of bar chart in StockEdge.
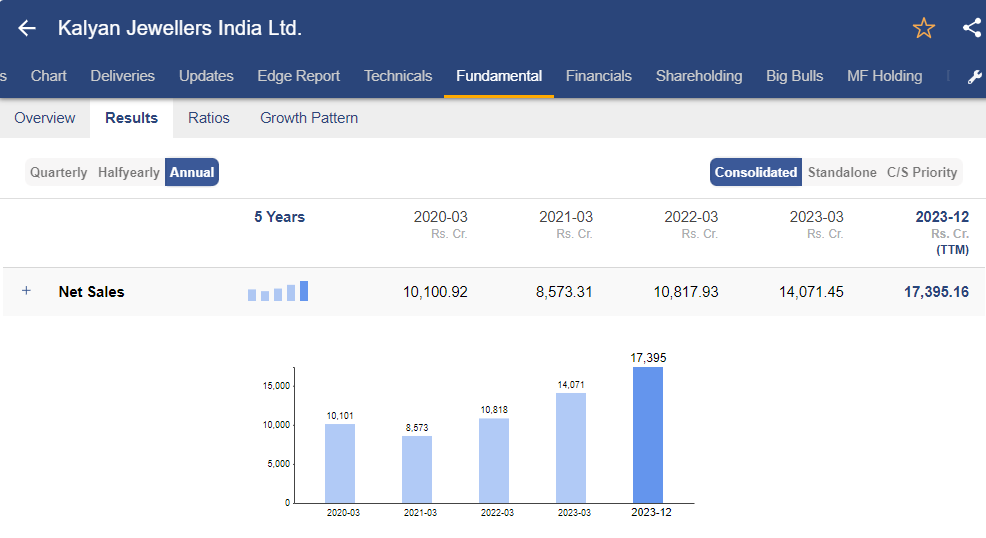
EBITDA growth– The company grew its EBITDA by 13.58% CAGR over the last 3-years. Take a look at EBITDA growth of Kalyan Jewellers Ltd.
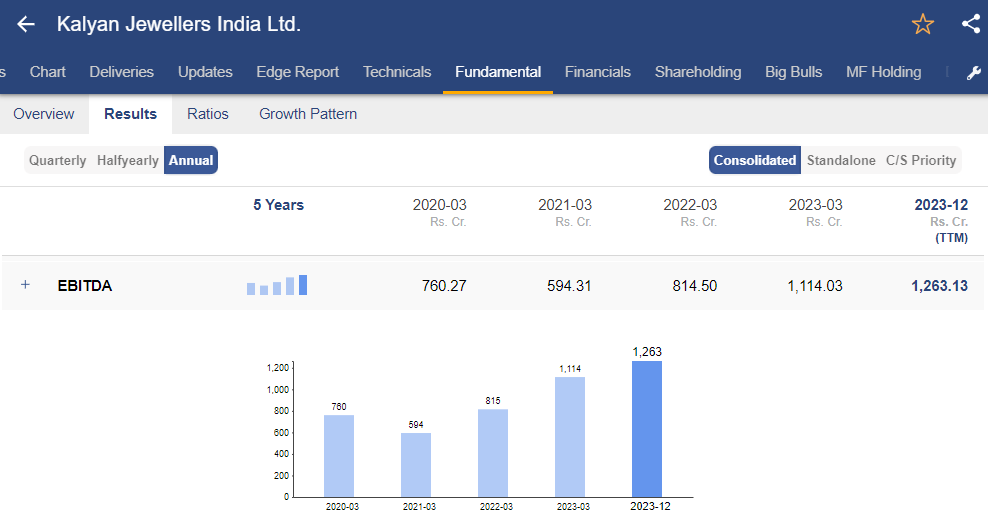
Now, let’s dive into the financial ratios of Kalyan Jewellers Ltd. Using StockEdge, you can easily do a ratio analysis of Kalyan Jewellers Ltd.
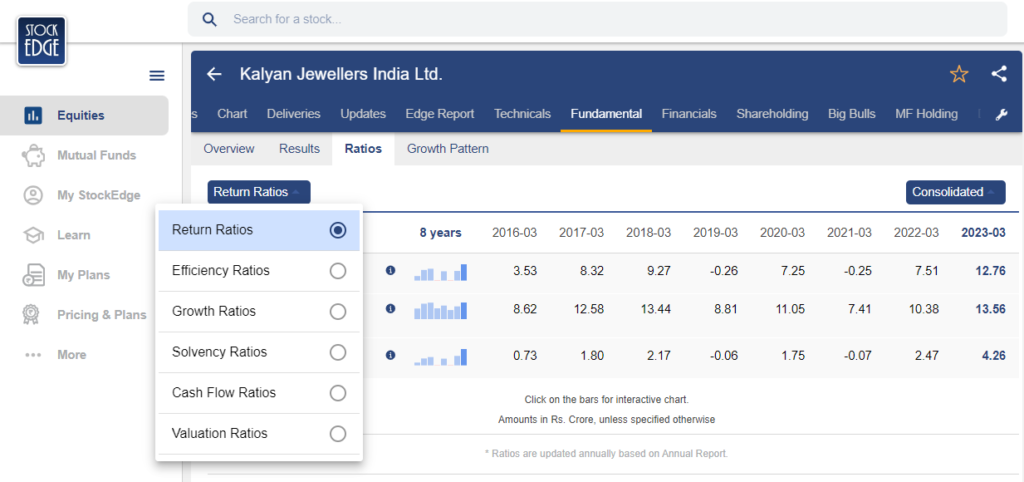
- Return on Equity (ROE) of Kalyan Jewellers Ltd. – The company posted an ROE of 12.76%, highest in the last 5-years.
- Debt– The company’s debt to equity stands at 0.97x, which is conservative..
- Valuation – The company is trading at a PE of 25.06x.
How to Hedge Your Portfolio by Investing in Gold?Look at the chart below.
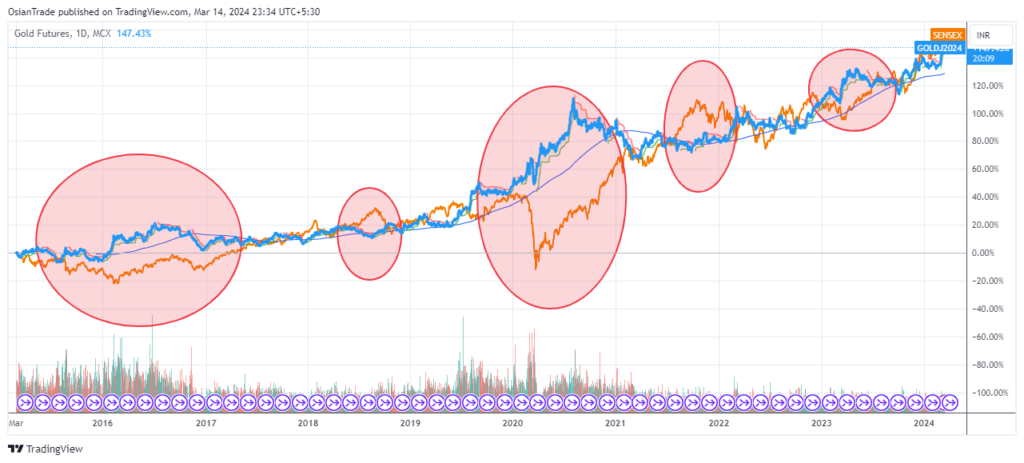
The blue line is Sensex returns, while the red line is gold returns. When the returns of one asset are positive and the other one is negative during a time frame, it is considered to have a negative correlation. It can be very well depicted that Gold and Sensex (Equity Markets) have a negative correlation.
A negative correlation is an apple to the eyes of portfolio managers as it helps them to diversify risk. Intuitively and empirically, gold (a safe haven) will typically increase when there is uncertainty in the economy and the stock markets will behave in the opposite manner as there is earnings risk during economic uncertainty. Additionally, gold is an inflation hedge due to its scarcity. Hence investment in gold is at a sweet spot.
The global economy has a lot of uncertainties this time due to many countries at war, inflation and debt at high levels and GDP growth slowing down. It might be a good opportunity to invest in gold.
Taxation on Gold Investment
Investment in gold attracts taxation differently between physical and various digital modes discussed. Additionally, Short Term Capital Gain (STCG) – less than 3 years holding and Long-Term Capital Gains (LTCG)- more than 3 years holding, are also taxed differently. Let’s look at it in this table:
| Physical | Gold ETF | Gold MF | SGB | Digital Gold through Fintech |
| 3% GST on purchase | No Tax on Purchase | No Tax on Purchase | No Tax on Purchase | No Tax on purchase |
| STCG as per income tax slab. | STCG as per income tax slab. | STCG as per income tax slab. | If sold within 3-year, taxed at the slab rate. | STCG as per income tax slab. |
| LTCG of 20% + 4% cess, along with indexation benefit. | LTCG of 20% + 4% cess, along with indexation benefit. | LTCG of 20% + 4% cess, along with indexation benefit. | Sold 1-8 years, taxed at 20% + 40% cess and indexation benefit only when held upto 3 year minimum to make it LTCG. Interest of 2.5% p.a. is taxed at the slab rate. | LTCG of 20% + 4% cess, along with indexation benefit. |
Conclusion
When millennials hear “Invest in Gold” from their parents, they generally feel that it’s a cliché investment. However, empirical evidence, along with gold’s characteristics, has shown that investment in gold can be two-arrowed.
- Higher return than inflation.
- Good hedge to the equity portfolio.
Hence, give your portfolio a conventional tilt and listen to your parents to “Invest in Gold”.


